
Markets almost unchanged this week and very close to testing 50 DMA support.
FED cut interest rate by quarter point but took away any hope for future cuts for this year but hinted for expanded balance sheet. On Monday Empire State manufacturing showed weakness. Store sales came in little lower than previous period. Manufacturing has recovered compared to prior period.
Chinese trade officials cut short a U.S. visit indicating lack of progress in trade talks. This led to reversal in markets on Friday afternoon.
The S&P has reached overbought levels short-term and has been consolidating these levels since 9/12. The retest of the rally highs on 9/19 was accompanied by the % of NYSE stocks above their respective 10MDA falling from 88% to 55%, showing increasing selectivity and a narrowing advance near-term. Some short-term models are on the edge of sell signals on further downside follow-thru next week. The odds still favor the Aug lows holding on any setback unless internals get much more negative. The most likely scenario would be for a setback of much less substance than the August correction and then a resumption of the strong intermediate-term rally mode – but news events are still wreaking havoc with the market and pushing it up and down within the context of the intermediate-term advance.
Leaders are not acting well. Breakouts are not holding indicating demand is weak for now.
This market is still news driven and it has the potential to disappoint us. Trade lightly.
Recap of last week:
Economic Reports:
| Economy Indicator | Released Date | Period | Prior | Prior Revised | Consensus | Actual |
| Empire State Mfg. Business Conditions | 9/16/2019 | Sept 2019 | 4.8 | 4.9 | 2.0 | |
| Redbook Store Sales Y/Y Change | 9/17/2019 | WK 9/14, 2019 | 6.4% | 5.4% | ||
| Industrial Production M/M Change | 9/17/2019 | Aug 2019 | -0.2% | -0.1% | 0.2% | 0.6% |
| Manufacturing M/M Change | 9/17/2019 | Aug 2019 | -0.4% | 0.1% | 0.5% | |
| Capacity Utilization Rate Level | 9/17/2019 | Aug 2019 | 77.5% | 77.6% | 77.9% | |
| Housing Market Index | 9/17/2019 | Sept 2019 | 66 | 67 | 66 | 68 |
| Foreign Demand for LT US Securities | 9/17/2019 | July 2019 | $99.1 B | $100.6 B | $84.3 B | |
| MBA Mortgage Applications W/W Change | 9/18/2019 | WK 9/13, 2019 | 2.0 % | -0.1 % | ||
| Housing Starts | 9/18/2019 | Aug 2019 | 1.191 M | 1.215 M | 1.215 M | 1.364 M |
| Housing Permits | 9/18/2019 | Aug 2019 | 1.336 M | 1.317 M | 1.300 M | 1.419 M |
| Federal Funds Rate | 9/18/2019 | 2.00 to 2.25 % | 1.75 to 2.00 % | |||
| Jobless New Claims | 9/19/2019 | WK 9/14, 2019 | 204 K | 206 K | 215 K | 208 K |
| Philadelphia FED Business Outlook | 9/19/2019 | Sept 2019 | 16.8 | 11.0 | 12.0 | |
| Existing Home Sales | 9/19/2019 | Aug 2019 | 5.420 M | 5.380 M | 5.490 M | |
| Leading Indicators | 9/19/2019 | Aug 2019 | 0.5 % | 0.4 % | 0.1 % | 0.0 % |
| FED Balance Sheet | 9/19/2019 | WK 9/18, 2019 | $3.770 T | $3.845 T | ||
| Money Supply M2 Weekly Change | 9/19/2019 | WK 9/9, 2019 | $40.6 B | $12.3 B | ||
| Baker-Hughes Rig Count | 9/20/2019 | WK 9/20, 2019 | 1020 | 987 |
This week’s major events:
| Monday | Chicago FED National Activity; PMI Composite Flash | ||
| Tuesday | Redbook; Core-logic Case-Shiller HPI; FHFA House Prime Index; Consumer Confidence Richmond FED Mfg. Index | ||
| Wednesday | MBA Mortgage Applications; New Home Sales; State Street Investor Confidence Index | ||
| Thursday | GDP; International Trade in Goods; Jobless Claims; Corporate profits; Retail Inventories; Wholesale Inventories; Pending Home Sales Index; Kansas City FED Mfg. Index; FED Balance Sheet; Money Supply | ||
| Friday | Durable Goods Orders; Personal Income and Outlays; Consumer Sentiment; Baker-Hughes Rig count |
Economy:
Jobless claims were unchanged. Retail sales were down but manufacturing recovered. FED cut interest rate by quarter point and hinted to increase size of the balance sheet soon. This may not be enough to weaken dollar against major trading partners. Leading indicator was lower. Philly Fed business outlook was lower.
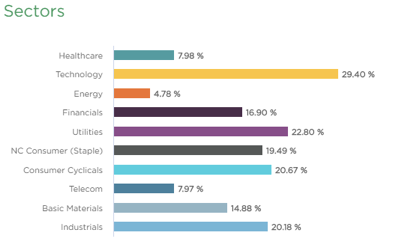
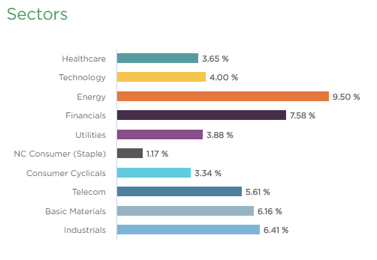
Sector performance:
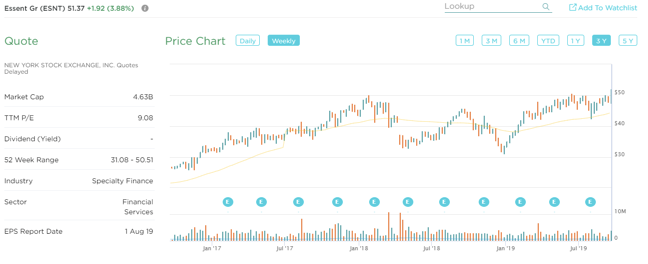
Stock to Watch: Essent Group Ltd (ESNT)
Essent offers private mortgage insurance and reinsurance for mortgages in all 50 states.
Essent has excellent annual earnings growth of 43%. Its has grown EPS $2.41 in 2016 to $4.77 in 2018. Recent quarterly EPS has grown 44%, 56%, 15%, 22%. Quarterly sales growth has been plus 20% for past eight quarters. Net Margins are consistently in mid-sixties. ROE is 22%. Management owns 3% of company. It pays 1.2% dividend and has no debt. Institutional sponsorship has grown from 554 to 678 in past four quarters. Both exhibit confidence in company management.
Price consolidation of over eighteen months is complete and ready to head higher. This has potential for substantial price appreciation over coming months.
Strongest groups are Energy-Solar, Mining-Gold/Silver, Retail Automobile, Aerospace/Defense, Building Construction, Telecom, Insurance, Semiconductor Equipment
Weakest groups are Oil and Gas, Retail-Mall, Tobacco, Steel Producers, Food
Watch List: Our strong RS/Growth screen is showing following candidates.
CMG, PAGS, PCTY, TEAM, RNG, EPAM, FIVN, LULU, SEDG, NOC, IPHI, COST, CPRT, ESNT
Summary:
Short-term indicators suggest caution near-term, but intermediate-term indicators are strong enough that any correction should be less substantial than that of August and should be relatively short-lived and transition to a rally to new highs in the weeks and months ahead. Trade lightly.