
Just like the selloff in December was historic, we are seeing a rally of historic proportion in the last few days. Markets rallied from oversold conditions and are now running into resistance area. VIX has declined to 18 after spiking at 36 on December 28. The market has rallied eleven percentage in last seven days. Unfortunately, this was news driven and not many Leaders are participating. At best, they are forming the right side of the bases. FED chairman Mr Powell’s dovish comments helped the market. But now, on last Thursday, Mr Powell suggested Fed Balance Sheet be ‘Substantially Smaller’. No one knows, how much smaller. This is a wild card regarding QT (Quantitative Tightening). Historically, there is no precedence of the effects of QT on economy and markets. The government shutdown continues with no agreement in Washington on ‘Border Wall’. This will impact the economy is another concern. Trade talks with China are continuing with the hope some deal will be reached. Brexit is at stake in tomorrows vote in British Parliament. We will let the market prove itself in coming days with three possibilities. The market may digest gains here before overcoming resistance levels will be healthy for bulls. The market could reverse here from these levels or march on ahead. Don’t plunge into the market. Get in methodically if the right conditions are met.
Recap of last week:
Ideal conditions for lasting Bull: Our best guess that for the bull market to take hold, Trump will have to avoid implementing new tariffs and come up with some kind of trade agreement where China and US can at least temporary claim victory and place some positive spin. Then China must implement targeted stimulus of some sort that prevents the deceleration of world trade from getting too much worse and the decline in the yuan from continuing. Finally, the FED needs to blink clearly and decisively and be prepared to blink further in terms of slowing QT if the economy decelerates much further. If we get these three developments, it may still be possible to avoid global recession and for the bull market to gradually reappear.
But if any of the above three big policy developments goes another way with substance, or if some debt crisis spillover becomes substantial, we may be looking at a global recession that is likely to morph itself into a rolling series of debt crises and an eventual downturn worse than 2007-2009 straight ahead. We suspect that the highest odds outcome is that three of the above will develop in the next quarter or two before markets take significant note. Investors are advised to understand the precarious nature of the global system and watch for things turning out differently ahead.
Economic Reports:
| Economy Indicator | Released Date | Period | Prior | Prior Revised | Consensus | Actual |
| Factory Orders | 1/7/2019 | Nov-18 | 2.1% | 0.4% | 0.4% | |
| ISM Non-Mfg Index | 1/7/2019 | Dec-18 | 60.70 | 58.40 | 57.60 | |
| Labor Dept JOLTS Openings | 1/8/2019 | Nov-18 | 7.079M | 7.131M | 6.888M | |
| FOMC Meeting Minutes | 1/9/2019 | |||||
| Jobless Claims | 1/10/2019 | Wk 1-5 | 231K | 233K | 224K | 216K |
| CPI M/M change | 1/11/2019 | Dec-18 | 0.0% | -0.1% | -0.1% | |
| CPI Y/Y change | 1/11/2019 | Dec-18 | 2.2% | 1.9% | 1.9% |
Jobless reports suggest economy is doing fine. CPI numbers are way below FED targets.
This week’s major events:
| Monday | Government Holiday |
| Tuesday | PPI -FD; Empire State Mfg Survey |
| Wednesday | Retail Sales; Business Inventories; Housing Market Index |
| Thursday | Housing Starts; Jobless Claims; Philadelphia Fed |
| Friday | Industrial Production; Consumer Sentiment |
Sector performance in last 3 month ending January 10, 2019:
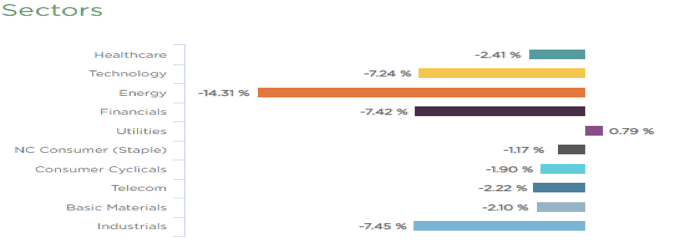
This past three months still shows poor performance except Utilities (defensive sector). Last two weeks have rallied close to eleven percentage points.
Strongest groups are Autos, Auto Parts, Aerospace, Apparel, Telecom
Weakest groups are Transportation & Steel.
Watch List: Our strong RS/Growth screen is showing few candidates, but list is lacking in numbers of stock showing leadership.
TEAM, CHGG, FN, PYPL, QNST, DORM, VRTX, FIVN, CASY, LLY
Summary: US & global markets have had impressive (11% on SPX & 13% on NASDAQ) rally in past seven days after breaking February lows and officially going in ‘Bear’ territory. Demand seems strong, but we are now testing resistance levels at prior support area. Leadership is lacking. We should be looking to open new positions if these resistance levels are broken through with conviction.