Market ended week much better closing near high for the weekly range. It had good three rally and now testing major resistance at 50DMA. That is 8000 level for Nasdaq and 2950 for S&P 500.
China trade war is entering new phase. We have seen Currency devaluation by China and possible currency war beginning. US has officially labeled China as “Currency manipulator”. China’s Yuan devaluation has a domino effect. South Korea signaled that it will intervene to keep its currency from appreciating, if needed. On Wednesday, Indian Reserve Bank and New Zealand delivered bigger than expected rate cuts and Thailand surprised with cut. These raise the specter of competitive devaluation. Only thing inflating is Gold.
Yield curve is becoming more inverted and FED seems to be lagging in rate cut. This could signal that we are getting close to recession. FED has the power to influence the outcome provided they make policy adjustments in September to accommodate the new reality.
This market is news driven and it has the potential to turn ugly. Protecting capital should be the focus while watching developments ahead.
Recap of last week:
Economic Reports:
| Economy Indicator | Released Date | Period | Prior | Prior Revised | Consensus | Actual |
| PMI Services Index | 8/5/2019 | July 2019 | 51.5 | 52.2 | 53 | |
| ISM Non-Mfg. Index | 8/5/2019 | July 2019 | 55.1 | 55.5 | 53.7 | |
| Ameritrade Investor Movement Index | 8/5/2019 | July 2019 | 4.61 | 4.60 | ||
| Redbook Store Sales Y/Y Change | 8/6/2019 | WK 8/3, 2019 | 4.5% | 5.1% | ||
| JOLTS Jobs Openings | 8/6/2019 | June 2019 | 7.323M | 7.384M | 7.293M | 7.348M |
| MBA Mortgage Applications W/W Change | 8/7/2019 | WK 8/2, 2019 | -1.4% | 5.3% | ||
| Consumer Credit M/M change | 8/7/2019 | June 2019 | $17.1B | $17.8B | $16.0B | $14.6B |
| Jobless New Claims | 8/8/2019 | WK 8/2, 2019 | 215K | 217K | 215K | 209K |
| Wholesale Inventories M/M % change | 8/8/2019 | June 2019 | 0.4% | 0.2% | 0.0% | |
| FED Balance Sheet | 8/8/2019 | WK 8/7, 2019 | $3.779T | $3.782T | ||
| Money Supply M2 Weekly Change | 8/8/2019 | WK 7/29, 2019 | $54.5B | $51.9B | $35.7B | |
| PPI FD M/M Change | 8/8/2019 | July 2019 | 0.1% | 0.2% | 0.2% | |
| PPI FD Y/Y Change | 8/8/2019 | July 2020 | 1.7% | 1.7% | 1.7% |
This week’s major events:
| Monday | Treasury Budget | ||
| Tuesday | Redbook; NFIB Small Business; CPI | ||
| Wednesday | MBA Mortgage Applications; Import Export prices; Atlanta FED Business Inflation Expectation | ||
| Thursday | Jobless Claims; Philadelphia Fed Business Outlook; Retail Sales; Empire State Mfg. Survey; Productivity and costs; Industrial production; Business Inventories; Housing Market Index; Fed Balance sheet; Money Supply | ||
| Friday | Housing starts; Quarterly Services report; Consumer sentiment; Baker-Hughes Rig Count |
Economy:
Chinese Yuan slipped to decade low on Monday. The 10-year Treasury yield kept plunging as low as 1.61%. That is cut in half since October. Copper prices slumped to a two-year low. Gold price surged past $1,500 an ounce for the first time since 2013.
When financial earthquakes happen, no one knows how big it will be, when it will stop or exactly what damage it will cause. President Trumps’ latest escalation of the China trade war has triggered that period now.
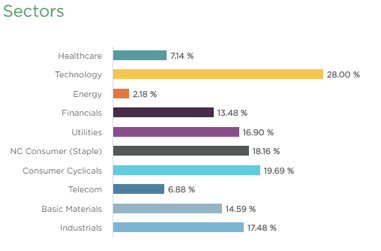
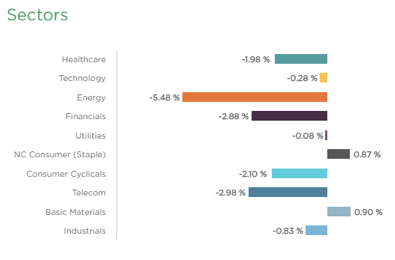
Sector performance:
Stock to Watch: None
Strongest groups are Energy-Solar, Mining-Gold/Silver, Computer-Tech services, Computer Software-enterprise, Telecom, Consumer Services-Education, Insurance, Aerospace/Defense, Computer Software-Security.
Weakest groups are Oil and Gas, Retail-Mall, Food, Auto, Media, Chemicals-Basic
Watch List: Our strong RS/Growth screen is showing following candidates.
CMG, TTD, OLED, PAGS, PAYC, PCTY, TEAM, VEEV, HEI, RNG, EPAM, SHOP, FIVN, ZS, LULU, V
Summary: Major indexes recovered a bit and now testing resistance at 50DMA. Three days rally doesn’t mean market has changed its down trend. This is not the time to look for bargains. Market is focused on progress in trade talks and state of global economy. These can be news driven in short term. Wait for demand to come back in. Market will give us signal when to get back in.