Market showed mixed emotions last week. On Tuesday it made a bold attempt to overcome resistance level but failed miserably on Wednesday. We doubt this rally until it closes above resistance at 50DMA. That is 8000 level for Nasdaq and 2950 for S&P 500.
Two major drivers for the market are China Trade talks and FED’s position on interest rate cuts in near future.
This market is news driven and it has the potential to turn ugly. Protecting capital should be the focus while watching developments ahead.
Recap of last week:
| Economy Indicator | Released Date | Period | Prior | Prior Revised | Consensus | Actual |
| Treasury Budget level | 8/12/2019 | July 2019 | $-8.5B | $-87.5B | $-119.7B | |
| NFIB Small Business Optimism Index | 8/13/2019 | July 2019 | 103.3 | 103 | 104.7 | |
| CPI M/M Change | 8/13/2019 | July 2019 | 0.1% | 0.2% | 0.3% | |
| CPI Y/Y Change | 8/13/2019 | July 2019 | 1.6% | 1.7% | 1.8% | |
| Redbook Store Sales Y/Y Change | 8/13/2019 | WK 8/10, 2019 | 5.1% | 4.4% | ||
| MBA Mortgage Applications W/W Change | 8/14/2019 | WK 8/9, 2019 | 5.3% | 21.7% | ||
| Import Prices M/M Change | 8/14/2019 | July 2019 | -0.9% | -1.1% | -0.1% | 0.2% |
| Export Prices M/M Change | 8/14/2019 | July 2019 | -0.7% | -0.6% | -0.1% | 0.2% |
| Import Prices Y/Y Change | 8/14/2019 | July 2019 | -2.0% | -2.0% | -1.8% | |
| Export Prices Y/Y Change | 8/14/2019 | July 2019 | -1.6% | -1.2% | -0.9% | |
| Atlanta Fed Business Infl. Expectations % Yr/Yr | 8/14/2019 | August 2019 | 1.9% | 2.0% | ||
| Jobless New Claims | 8/15/2019 | WK 8/9, 2019 | 209K | 211K | 208K | 220K |
| Philadelphia FED Business Outlook | 8/15/2019 | August 2019 | 21.8 | 11.1 | 16.8 | |
| Retail Sales M/M change | 8/15/2019 | July 2019 | 0.4% | 0.3% | 0.4% | 1.0% |
| Retail Sales less autos M/M change | 8/15/2019 | July 2019 | 0.4% | 0.4% | 0.2% | 0.4% |
| Empire State Mfg. Business Conditions | 8/15/2019 | August 2019 | 4.3 | 2.5 | 4.8 | |
| Non-farm Productivity Q/Q change | 8/15/2019 | Q2:2019 | 3.4% | 3.5% | 1.5% | 2.3% |
| Unit Labor Costs Q/Q Change | 8/15/2019 | Q2:2019 | -1.6% | 5.5% | 2.0% | 2.4% |
| Industrial Production M/M Change | 8/15/2019 | July 2019 | 0.0% | 0.2% | 0.1% | -0.2% |
| Manufacturing M/M Change | 8/15/2019 | July 2019 | 0.4% | 0.6% | -0.1% | -0.4% |
| Capacity Utilization Rate Level | 8/15/2019 | July 2019 | 77.9% | 77.8% | 77.8% | 77.5% |
| Business Inventories M/M Change | 8/15/2019 | June 2019 | 0.3% | 0.1% | 0.0% | |
| Housing Market Index | 8/15/2019 | August 2019 | 66 | 66 | 66 | |
| Foreign Demand for LT US Securities | 8/15/2019 | June 2019 | $3.5B | $4.6B | $99.1B | |
| FED Balance Sheet | 8/15/2019 | WK 8/14, 2019 | $3.782T | $3.786T | ||
| Money Supply M2 Weekly Change | 8/15/2019 | WK 8/5, 2019 | $35.7B | $35.7B | $23.8B | |
| Housing Starts | 8/16/2019 | July 2019 | 1.253M | 1.241M | 1.259M | 1.191M |
| Housing Permits | 8/16/2019 | July 2019 | 1.220M | 1.232M | 1.270M | 1.336M |
| Consumer Sentiment | 8/16/2019 | August 2019 | 98.4 | 97.5 | 92.1 | |
| Baker-Hughes Rig Count | 8/16/2019 | WK 8/16, 2019 | 1074 | 1077 |
Economic Reports:
This week’s major events:
| Monday | Commerce Retail Sales | ||
| Tuesday | Redbook | ||
| Wednesday | MBA Mortgage Applications; Existing Home Sales; FOMC Minutes | ||
| Thursday | Jobless Claims; PMI Corporate Flash; Leading Indicators; Kansas City Fed Survey; Balance sheet; Money Supply | ||
| Friday | New Home Sales; FED Chair Speaks; Baker-Hughes Rig Count |
Economy:
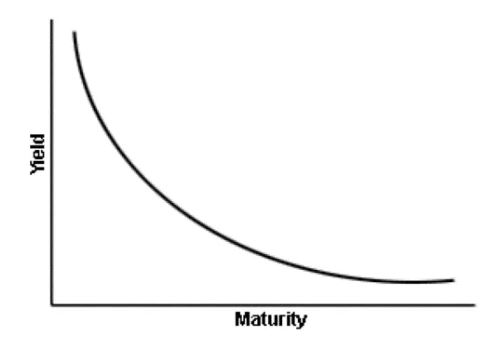
Retail sales came in strong discounting fear of recession ahead. Yield curve, near term implies how far FED policy is from market reality. Let us see if FED catches up soon with further rate cuts.
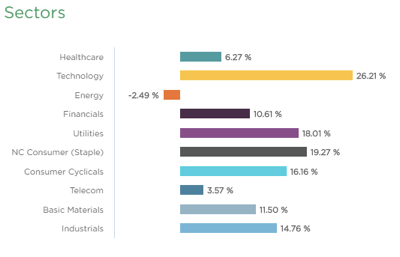
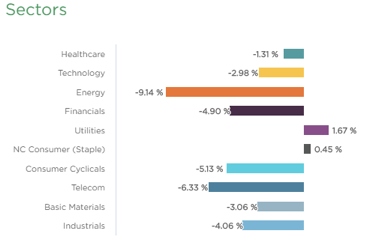
Sector performance:
Stock to Watch: None
Strongest groups are Energy-Solar, Mining-Gold/Silver, Computer-Tech services, Computer Software-enterprise, Telecom, Consumer Services-Education, Insurance, Aerospace/Defense, Computer Software-Security.
Weakest groups are Oil and Gas, Retail-Mall, Food, Auto, Media, Chemicals-Basic
Watch List: Our strong RS/Growth screen is showing following candidates.
CMG, TTD, OLED, PAGS, PAYC, PCTY, TEAM, VEEV, HEI, RNG, EPAM, SHOP, FIVN, ZS, LULU, V
Summary:
Major indexes recovered a bit and now testing resistance at 50DMA. Market is focused on progress in trade talks and state of global economy. These can be news driven in short term. Wait for demand to come back in. Market will give us signal when to get back in.