
Complacency from President escalates to new level. He just opened third front by announcing Mexico Tariffs of 5% beginning June 5 and ready to expand to 25%, if Mexico do not help him with Immigration issues. This is after new NAFTA deal was agreed upon. This doesn’t bode well for markets. Markets do not like uncertainty, and they are losing confidence in Trump’s broad strategy on trade and where it goes from here. He also opened new front at home by declaring ‘not to work with Democrats’ until they stop ‘witch-hunt’. Markets interpret this as President is losing focus. Seems like markets want to give President ‘wakeup call’ on reality. Strong economy can easily roll into recession. The FED policymakers are in wait-and-see mode on whether the trade war will take a toll on the economy. FED is again being reactive.
Chinese economy and other global economies are showing signs of weakening. Copper is making lower lows while Gold is trying to break out from consolidation area.
Inverted yield curve is here since FED stance on no increase in interest rates in March. 10-year treasury yield now is 2.24% vs T-bills at 2.35%. Yield curve is not an accurate indicator for bear market timing and sometimes have given false signal.
Other geo-political hotspots to watch are Iran sanctions, Israel re-elections, N. Korea, British elections & BREXIT timetable, EURO elections affecting German politics.
Market correction deepens and have taken few support levels last week and may be near oversold. Next support level for SPX is 2725. We could see some change in direction short-term.
The market is in ‘Down Trend’. Protecting capital should be the goal in this “Trump” driven environment.
Recap of last week:
Economic Reports:
| Economy Indicator | Released Date | Period | Prior | Prior Revised | Consensus | Actual |
| Case Shiller HPI | 5/28/2019 | March 2019 | 0.2% | 0.3% | 0.2% | 0.1% |
| FHA Housing Price Index | 5/28/2019 | March 2019 | 0.3% | 0.3% | 0.1% | |
| Consumer Confidence | 5/28/2019 | May 2019 | 129.2 | 129.2 | 129.9 | 134.1 |
| Dallas Fed Mfg. Survey | 5/28/2019 | May 2019 | 12.4 | 6.3 | ||
| MBA Mortgage Applications W/W Change | 5/29/2019 | WK 5/24, 2019 | 2.4% | -3.3% | ||
| Redbook Store Sales Y/Y Change | 5/29/2019 | WK 5/25, 2019 | 5.2% | 5.7% | ||
| Richmond Fed Mfg. Index | 5/29/2019 | May 19 | 3 | 6 | 5 | |
| State Street Investor Confidence Index | 5/29/2019 | May 19 | 72.9 | 79.5 | ||
| Real GDP Q/Q Change | 5/30/2019 | Q2:2019 | 1.2% | 1.2% | 1.3% | |
| Consumer Spending Q/Q Change | 5/30/2019 | Q2:2019 | 0.1% | 0.3% | 0.3% | 0.1% |
| International Trade in Goods Balance | 5/30/2019 | April 19 | $-71.4B | $-71.9B | $-71.9B | $-72.1B |
| Jobless New Claims | 5/30/2019 | WK 5/26, 2019 | 211K | 212K | 215K | 215K |
| Corporate After-Tax Profits Y/Y change | 5/30/2019 | Q1:19 | 11.1% | 11.2% | 1.6% | |
| Retail Inventories M/M % change | 5/30/2019 | April 19 | -0.3% | 0.5% | ||
| Wholesale Inventories M/M % change | 5/30/2019 | April 19 | 0.0% | 0.3% | 0.7% | |
| Pending Home Sales M/M Change | 5/30/2019 | April 19 | 3.8% | 3.9% | 0.5% | -1.5% |
| FED Balance Sheet | 5/30/2019 | WK 5/29, 2019 | $3.865T | $3.851T | ||
| Money Supply Weekly Change | 5/30/2019 | WK4/29, 2019 | $3.0B | $2.9B | $45.5B | |
| Personal Income M/M change | 5/31/2019 | April 19 | 0.1% | 0.3% | 0.5% | |
| Consumer Spending M/M Change | 5/31/2019 | April 19 | 0.9% | 1.1% | 0.2% | 0.3% |
| Chicago PMI | 5/31/2019 | May 19 | 52.6 | 53.6 | 54.2 | |
| Consumer Sentiment | 5/31/2019 | May 19 | 102.4 | 101.5 | 100.00 | |
| Baker-Hughes Rig Count | 5/31/2019 | WK 5/31, 2019 | 1061 | 1069 |
This week’s major events:
| Monday | PMI Mfg. Index; ISM Mfg. Index; Construction Spending | ||
| Tuesday | Motor Vehicle Sales; Redbook; Factory Orders | ||
| Wednesday | MBA Mortgage Applications; ADP Employment Report; PMI Services Index; ISM Non-Mfg. Index | ||
| Thursday | Challenger Job-Cut Report; Jobless Claims; International Trade; Productivity & Costs; Qtrly Services Survey; FED Balance Sheet; Money Supply | ||
| Friday | Employment Situation; Wholesale Trade; Consumer Credit; Baker-Hughes Rig count | ||
Economy:
Personal income rose 0.5% in April, while consumer spending climbed 0.3%. Inflation adjusted spending growth continued to bounce back. Inflation rose 0.3% vs March and 1.6% vs year earlier.
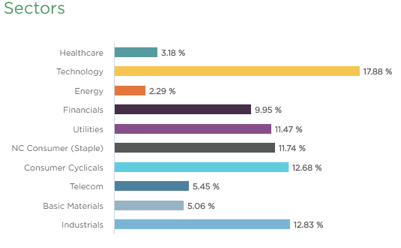
Sector performance YTD performance ending May 31, 2019:

Stock to Watch:
Let us watch for high RS stocks for now but hold on buying into new positions until signs of demand returning into market.
Strongest groups are Software, Insurance, Business service, Insurance, Computer-Tech services, Computer Software-enterprise, Computer Software-Database, Telecom, Computer Software-Security.
Weakest groups are Retail; Food, Energy, Media; Medical
Watch List: Our strong RS/Growth screen is showing following candidates.
TEAM, CHGG, PYPL, CYBR, FIVN, CASY, LLY, LULU, NOW, HUBS, FIVE, ADBE, ADSK, MSFT, HEIA, TWLO, WDAY, ETSY, EPAM, MTCH, LPLA, GDDY; AMZN, PAGS, FB, FNKO, BAH, CPRT, ENTH, HEI, LLL, PAYC, PGR, PODD, VEEV, VRSN, KL
Summary:
Markets have broken important support levels and are in correction. Short-term bounce is likely with near oversold condition. Look out for strong RS stocks in this correction for future leadership to emerge.