
Market rally is facing resistance zone here. G20 meeting went without a hitch. President Trump’s meeting with Chinese Premier were civil and gave indication that tariff situation will not escalate. President’s visit to N. Korea’s DMZ zone was a last-minute surprise. He is the first US president to visit N. Korea since cold war. Markets reacted overnight with solid gains but has given back most of the gains.
VIX closed at support level of 14.40. It needs to close below 14.40 level for validation of this trend. Markets remain news driven. We need to be vigilant.
Let’s watch for improvement in leadership, internals, and increased quality breakouts in top stocks in top groups ahead, and start to reorient our head toward a more bullish bias if evidence continues to grow for a new leg up.
The market is in Uptrend.
Recap of last week:
Economic Reports:
| Economy Indicator | Released Date | Period | Prior | Prior Revised | Consensus | Actual |
| Chicago Fed National Activity | 6/24/2019 | May 19 | -0.45 | -0.48 | -0.18 | -0.05 |
| Dallas Fed Mfg. Survey | 6/24/2019 | June 2019 | 6.3 | 8.9 | ||
| Redbook Store Sales Y/Y Change | 6/25/2019 | WK 6/22, 2019 | 5.4% | 5.0% | ||
| Case Shiller HPI | 6/25/2019 | April 2019 | 0.1% | 0.3% | 0.2% | 0.0% |
| FHA Housing Price Index | 6/25/2019 | April 2019 | 0.1% | 0.2% | 0.4% | |
| New Home Sales | 6/25/2019 | May 19 | 673K | 679K | 680k | 626K |
| Consumer Confidence | 6/25/2019 | June 2019 | 134.1 | 131.3 | 132 | 121.5 |
| Richmond Fed Mfg Index | 6/25/2019 | June 19 | 5 | 4 | 3 | |
| MBA Mortgage Applications W/W Change | 6/26/2019 | WK 6/21, 2019 | -3.4% | 1.3% | ||
| Durable Goods Order M/M Change | 6/26/2019 | May 19 | -2.1% | -2.8% | -0.1% | -1.3% |
| International Trade in Goods Balance | 6/26/2019 | May 19 | $-72.1B | $-70.9B | $-71.5B | $-74.6B |
| Retail Inventories M/M % change | 6/26/2019 | May 2019 | 0.5% | 0.6% | 0.5% | |
| Wholesale Inventories M/M % change | 6/26/2019 | May 2019 | 0.7% | 0.9% | 0.4% | 0.4% |
| State Street Investor Confidence Index | 6/26/2019 | June 2019 | 79.5 | 79.4 | 87.6 | |
| Real GDP Q/Q Change | 6/27/2019 | Q1:2019 | 3.1% | 3.1% | 3.1% | |
| Consumer Spending Q/Q Change | 6/27/2019 | Q1:2019 | 1.3% | 1.3% | 0.9% | |
| Jobless New Claims | 6/27/2019 | WK 6/22, 2019 | 216K | 217K | 218K | 227K |
| Corporate After-Tax Profits Y/Y change | 6/27/2019 | Q1:19 | 1.6% | 2.3% | ||
| Pending Home Sales M/M Change | 6/27/2019 | May 2019 | -1.5% | 0.6% | 1.1% | |
| Kansas City Fed Index | 6/27/2019 | June 2019 | 4 | 3 | 0 | |
| FED Balance Sheet | 6/27/2019 | WK 6/26, 2019 | $3.844T | $3.827T | ||
| Money Supply Weekly Change | 6/27/2019 | WK 6/17, 2019 | $40.9B | $27.0B | ||
| Personal Income M/M change | 6/28/2019 | May 2019 | 0.5% | 0.3% | 0.5% | |
| Consumer Spending M/M Change | 6/28/2019 | May 2019 | 0.3% | 0.6% | 0.4% | 0.4% |
| Chicago PMI | 6/28/2019 | June 2019 | 54.2 | 53.6 | 49.7 | |
| Consumer Sentiment | 6/28/2019 | June 2019 | 97.9 | 97.9 | 98.2 | |
| Baker-Hughes Rig Count | 6/28/2019 | WK 6/28, 2019 | 1086 | 1091 |
This week’s major events:
| Monday | PMI Mfg. Index; ISM Mfg. Index; Construction Spending | ||
| Tuesday | Redbook | ||
| Wednesday | MBA Mortgage Applications; Challenger Job-Cut Report; ADP Employment Report; International Trade; Jobless Claims; PMI Services Index; Factory Orders; ISM Non-Mfg. Index | ||
| Thursday | HOLIDAY | ||
| Friday | Employment Situation; Baker-Hughes Rig Count; FED Balance Sheet; Money Supply |
Economy:
Wholesale inventories declined. GDP remains at 3.1%. Consumer spending up slightly so is income. Economy is solid. G20 meeting went without a hitch and so talks with Chinese for now. Markets have got everything it has been waiting for. Demand should come in to validate. We are entering summer months which historically tend to be thin.
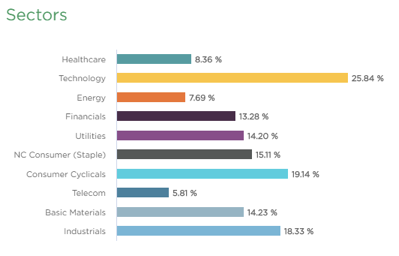
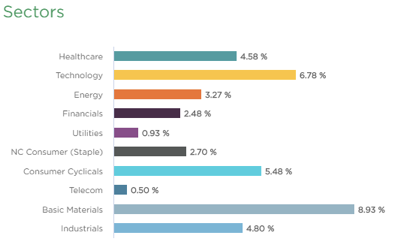
Sector performance:
Stocks to Watch:
Following is the list of companies with higher sales growth, earnings growth with efficient management. We suggest you do further analysis and watch them for developing opportunities.
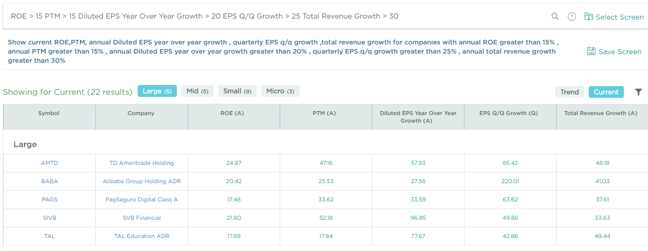
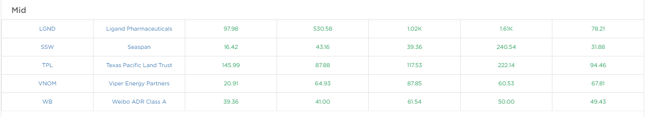
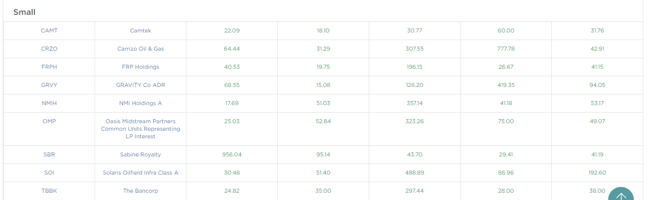
Chart 3. Watch list screen. Courtesy www.Vistalytics.com
Strongest groups are Energy, Software, Insurance, Business service, Insurance, Computer-Tech services, Computer Software-enterprise, Computer Software-Database, Telecom, Computer Software-Security.
Weakest groups are Retail, Food, Auto, Media, Medical
Watch List: Our strong RS/Growth screen is showing following candidates.
TEAM, CHGG, PYPL, CYBR, FIVN, SHOP, LLY, LULU, NOW, HUBS, FIVE, ADBE, ADSK, MSFT, HEIA, TWLO, WDAY, ETSY, EPAM, MTCH, LPLA, GDDY; AMZN, PAGS, FB, FNKO, BAH, CPRT, ENTH, HEI, LLL, PAYC, PGR, PODD, VEEV, VRSN, KL, GNRC, CACC, AMD, MDSO
Summary: Resistance is being challenged here. Look out for strong RS stocks and add early leaders or new ones that are emerging here