
Markets respected resistance level and backed off on Friday. Now we must watch the test of August 5 lows ahead. Character of the test will determine what should we expect in next coming weeks. Volatility index must come down below 15 for market to find legs again.
Two major drivers for the market kicked in on Friday with opposing outcome. Mr. Powell indicated the prospect of rate cuts due to his concern about lingering trade talks taking market higher initially. Then followed President Trump’s twit in response to Chinese new tariffs. That drove markets towards lows of this month. Markets seem to have realized that trade talks are going no where and FED will cut rates only with review of the data, meaning lagging to counteract the effect of trade tariffs.
This market is news driven and it has the potential to turn ugly. Protecting capital should be the focus while watching developments ahead.
Recap of last week:
Economic Reports:
| Economy Indicator | Released Date | Period | Prior | Prior Revised | Consensus | Actual |
| E-Commerce Sales Q/Q Change | 8/19/2019 | Q2:2019 | 3.6% | 4.2% | ||
| Redbook Store Sales Y/Y Change | 8/20/2019 | WK 8/17, 2019 | 4.4% | 4.9% | ||
| MBA Mortgage Applications W/W Change | 8/21/2019 | WK 8/16, 2019 | 21.7% | -0.9% | ||
| Existing Home Sales | 8/21/2019 | July 2019 | 5.270M | 5.290M | 5.385M | 5.420M |
| Jobless New Claims | 8/22/2019 | WK 8/17, 2019 | 220K | 221K | 216K | 209K |
| PMI Composite Flash | 8/22/2019 | August 2019 | 51.6 | 51.9 | 50.9 | |
| Leading Indicators | 8/22/2019 | July 2019 | -0.3% | -0.1% | 0.2% | 0.5% |
| Kansas City Fed Index | 8/22/2019 | August 2019 | -1 | -6 | ||
| FED Balance Sheet | 8/22/2019 | WK 8/21, 2019 | $3.786T | $3.765T | ||
| Money Supply M2 Weekly Change | 8/22/2019 | WK 8/12, 2019 | $23.8B | $14.6B | ||
| New Home Sales | 8/23/2019 | July 2019 | 646 K | 728 K | 645 K | 635 K |
| Baker-Hughes Rig Count | 8/23/2019 | WK 8/23, 2019 | 1077 | 1055 |
This week’s major events:
| Monday | Durable Goods Order; Chicago Fed National Activity; Dallas Fed Mfg. Survey | ||
| Tuesday | Redbook; Shiller HPI; House Price Index; Consumer Confidence; Richmond FED Mfg. Index | ||
| Wednesday | MBA Mortgage Applications; State Street Investor Confidence Index | ||
| Thursday | GDP; Jobless Claims; Wholesale Inventories; Pending Home sales Index; FED Balance Sheet; Money Supply | ||
| Friday | Chicago PMI; Consumer Sentiment; Baker-Hughes Rig Count |
Economy:
Week was lighter on economic reports. FED Chair’s speech on Friday at Jackson Hole was promising for future rate cuts. Same cannot be said about China trade war. Chinese put more tariffs effective September 1, 2019. Mr. Trump announced he will retaliate and encouraged companies not to do business in China. But then again, on Monday both sides are stating as if they are ready to make a deal. This kind of talk has gone back and forth many times before. Real progress is missing and as we said earlier market needs proof. President’s Economic Advisor, Mr. Kudlow, indicated prospect of tax cuts before election 2020.
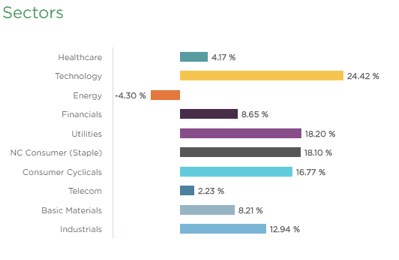
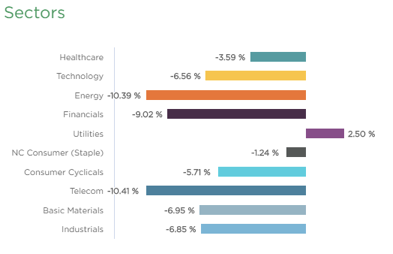
Sector performance:
Stock to Watch: None
Strongest groups are Energy-Solar, Mining-Gold/Silver, Utilities, Computer-Tech services, Computer Software-enterprise, Consumer Services-Education, Insurance, Aerospace/Defense, Computer Software-Security.
Weakest groups are Oil and Gas, Retail-Mall, Food, Auto, Media, Chemicals-Basic
Watch List: Our strong RS/Growth screen is showing following candidates.
CMG, TTD, OLED, PAGS, PAYC, PCTY, TEAM, VEEV, HEI, RNG, EPAM, SHOP, FIVN, LULU, V
Summary:
Major indexes reacting from resistance at 50DMA and close to August 5, 2019 lows this week. Market has lost confidence for any progress in near future and concerned about global economy. This week was typical example of news driven market. Wait for better environment to tip your toes back in.