
Markets got a big boost this week from news about China Trade talks. Markets overcame major resistance at 50 DMA. Volatility index has come down to 15 indicating market wants to move higher.
Leaders are also acting well last two days confirming our sentiments for upside.
This market is still news driven and it has the potential to disappoint us.
Recap of last week:
Economic Reports:
| Economy Indicator | Released Date | Period | Prior | Prior Revised | Consensus | Actual |
| PMI Mfg. Index | 9/3/2019 | “August 2019 | 50.4 | 49.9 | 50.3 | |
| ISM Mfg. Index | 9/3/2019 | August 2019 | 51.2 | 51.3 | 49.1 | |
| Construction spending M/M Change | 9/3/2019 | August 2019 | -1.3% | -0.7% | 0.3% | 0.1% |
| MBA Mortgage Applications W/W Change | 9/4/2019 | WK 8/30, 2019 | -6.2% | -3.1% | ||
| International Trade Balance | 9/4/2019 | July 2019 | $-55.2B | $-55.5B | $-53.5B | $-54.0B |
| Redbook Store Sales Y/Y Change | 9/4/2019 | WK 8/31, 2019 | 5.7% | 6.5% | ||
| Motor Vehicle Sales | 9/5/2019 | August 2019 | 16.8 M | 16.8 M | 17.0 M | |
| Challenger Job cut Report | 9/5/2019 | August 2019 | 38,845 | 53,480 | ||
| ADP Employment Report | 9/5/2019 | August 2019 | 156,000 | 142,000 | 160,000 | 195,000 |
| Jobless New Claims | 9/5/2019 | WK 8/31, 2019 | 215 K | 216 K | 215 K | 217 K |
| Non-farm Productivity Q/Q change | 9/5/2019 | Q2(r):2019 | 2.3% | 2.3% | 2.3% | |
| Unit Labor Costs Q/Q Change | 9/5/2019 | Q2(r):2019 | 2.4% | 2.4% | 2.6% | |
| PMI Services Index | 9/5/2019 | August 2019 | 53 | 50.9 | 50.7 | |
| ISM Non-Mfg. Index | 9/5/2019 | August 2019 | 53.7 | 54 | 56.4 | |
| Factory Orders M/M Change | 9/5/2019 | July 2019 | 0.6% | 0.5% | 1.0% | 1.4% |
| FED Balance Sheet | 9/5/2019 | WK 9/4, 2019 | $3.760T | $3.762T | ||
| Money Supply M2 Weekly Change | 9/5/2019 | WK 8/26, 2019 | $-5.0 B | $-3.0 B | $20.6 B | |
| Non-farm Payrolls M/M change | 9/6/2019 | August 2019 | 164,000 | 159,000 | 163,000 | 130,000 |
| Unemployment Rate | 9/6/2019 | August 2019 | 3.7 % | 3.7 % | 3.7 % | |
| Private Payrolls M/M Change | 9/6/2019 | August 2019 | 148,000 | 131,000 | 150,000 | 96,000 |
| Average Hourly Earnings M/M change | 9/6/2019 | August 2019 | 0.3 % | 0.3 % | 0.4 % | |
| Average Workweek | 9/6/2019 | August 2019 | 34.3 hrs. | 34.4 hrs. | 34.4 hrs. | |
| Baker-Hughes Rig Count | 9/6/2019 | WK 9/6, 2019 | 1054 | 1045 |
This week’s major events:
| Monday | Consumer Credit; Ameritrade Investor sentiment | ||
| Tuesday | NFIB small business optimism index; Redbook; JOLTS report | ||
| Wednesday | MBA Mortgage Applications; PPI-FD; Atlanta Fed Business Inflation Expectations; Wholesale trade | ||
| Thursday | Jobless Claims; CPI; FED Balance Sheet; Money Supply | ||
| Friday | Retail sales; Import and Export Prices; Business inventories; Consumer sentiment; Baker-Hughes Rig count |
Economy:
Jobs reports were disappointing. FED Chair’s sees no recession in economy. China trade talk hopes come alive again. Real progress is missing and must be alert. Both sides need face saving deal for their own political interests.
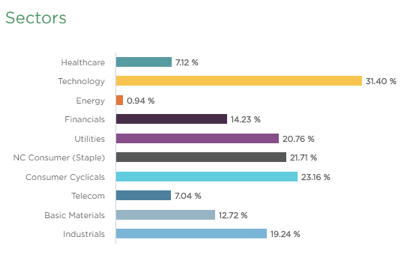
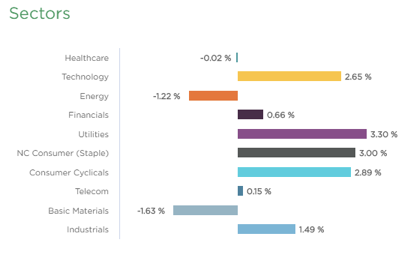
Sector performance:
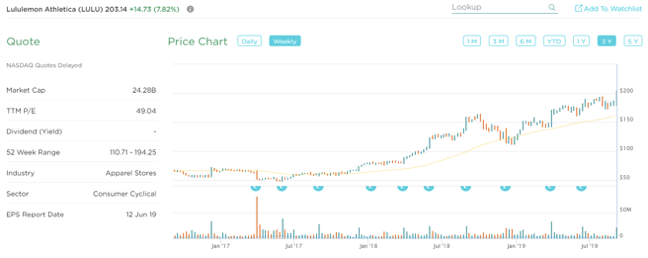
Stock to Watch: Lululemon Athletica (LULU)
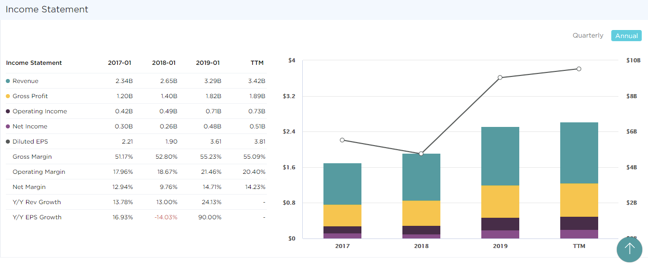
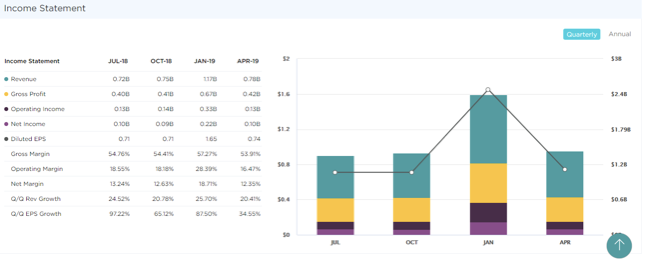
Lululemon Athletica is a Canadian company. It designs, distributes and markets athletic apparel and accessories for men, women and girls. It has annual EPS growth close to 20. EPS has grown from $1.88 in 2016 to $2.59 in 2019. Its ROE is 34%. Its gross margins have expanded from 51% to 55% and operating margins have expanded from 17% to 21%. Revenue growth has accelerated from 14% to 20%. Quarterly revenue growth is plus 20%.
Institutional sponsorship has steadily expanded from 1100 to 1400 over past four quarters. Relative strength is solid and prices are breaking out of new base last week.
Strongest groups are Energy-Solar, Mining-Gold/Silver, Utilities, Computer-Tech services, Computer Software-enterprise, Consumer Services-Education, Insurance, Aerospace/Defense, Computer Software-Security.
Weakest groups are Oil and Gas, Retail-Mall, Food, Auto, Media, Chemicals-Basic
Watch List: Our strong RS/Growth screen is showing following candidates.
CMG, TTD, OLED, PAGS, PAYC, PCTY, TEAM, VEEV, HEI, RNG, EPAM, SHOP, FIVN, LULU, V, MA, EDU, COST, FICO
Summary:
Major indexes overcame resistance at 50DMA. Volatility has come down to normal and leadership is acting well indicating positive environment near term barring news impact. It’s ok to participate in the market with caution.