
The stock market powered higher Friday afternoon as Wall Street grew optimistic about the outcome of trade talks with China. President met with Chinese Vice Premier Liu He. It resulted in the announcement of the partial trade deal, which could set up a truce in the U.S.-China trade war. Trump said the agreement is “very substantial phase one” deal. The most concrete result from the China trade talks is that Trump will hold off on China tariff hikes set for Tuesday. There is no China-deal on paper.
FED Chairman indicated willingness to lower rates ahead.
BREXIT negotiations may be bearing some positive outcome on Ireland border with EU this week. This could give one more excuse to celebrate for Bulls. Let’s see.
Earnings season is starting in a week.
After selloffs earlier in the week, the market bounced back strongly on Thursday and Friday to close the week up. This is a good start for bulls, but major resistance lies ahead. Despite the increase in positive action on major indexes, investors have yet to receive the all-clear signal to begin buying stocks heavily. We need to see follow up action this week.
Recap of last week:
Economic Reports:
| Economy Indicator | Released Date | Period | Prior | Prior Revised | Consensus | Actual |
| Consumer Credit M/M change | 10/7/2019 | August 2019 | $23.3 B | $23 B | $17 B | $17.9 B |
| NFIB Small Business Optimism Index | 10/8/2019 | Sept 2019 | 103.1 | 103.1 | 102 | 101.8 |
| PPI FD M/M Change | 10/8/2019 | Sept 2019 | 0.1% | 0.1% | -0.3 % | |
| PPI FD Y/Y Change | 10/8/2019 | Sept 2019 | 1.8 % | 1.8 % | 1.4 % | |
| Store Sales Y/Y Change | 10/8/2019 | WK 10/5, 2019 | 5.8 % | 5.7 % | ||
| MBA Mortgage Applications W/W Change | 10/9/2019 | WK 10/04, 2019 | 8.1 % | 5.2 % | ||
| JOLTS Jobs Openings | 10/9/2019 | August 2019 | 7.217M | 7.174 M | 7.186 M | 7.051 M |
| Wholesale Inventories M/M % change | 10/9/2019 | August 2019 | 0.2 % | 0.4 % | 0.2 % | |
| CPI M/M Change | 10/10/2019 | Sept 2019 | 0.1% | 0.0% | 0.0% | |
| CPI Y/Y Change | 10/10/2019 | Sept 2019 | 1.7% | 1.8% | 1.7% | |
| Jobless New Claims | 10/10/2019 | WK 10/5, 2019 | 219 K | 220 K | 219 K | 210 K |
| FED Balance Sheet | 10/10/2019 | WK 10/9, 2019 | $3.946 T | $3.950 T | ||
| Money Supply M2 Weekly Change | 10/10/2019 | WK 9/30, 2019 | $70.2 B | $70.1 B | $49.9 B | |
| Import Prices M/M Change | 10/11/2019 | Sept 2019 | -0.5% | -0.2 % | -0.1% | 0.2% |
| Export Prices M/M Change | 10/11/2019 | Sept 2019 | -0.6% | 0.0% | -0.2% | |
| Import Prices Y/Y Change | 10/11/2019 | Sept 2019 | -2.0% | -1.8% | -1.8% | -1.6% |
| Export Prices Y/Y Change | 10/11/2019 | Sept 2019 | -1.4% | -1.3% | -1.6% | |
| Consumer Sentiment | 10/11/2019 | Oct.(p) 2019 | 93.2 | 92 | 96 | |
| Baker-Hughes Rig Count | 10/11/2019 | WK 10/11, 2019 | 999 | 1002 |
This week’s major events:
| Monday | ||
| Tuesday | Redbook; Empire state mfg. Survey | |
| Wednesday | MBA Mortgage Applications; Retail Sales; Atlanta Fed Business Inflation Expectation; Business Inventories; Housing market Index; Beige Book; Treasury International Capital | |
| Thursday | Housing starts; Jobless Claims; Philadelphia Fed Business Outlook Survey; Industrial Production; FED Balance sheet; Money supply | |
| Friday | Leading Indicators; Baker-Hughes Rig count |
Economy:
PPI reports were lower. JOLTS jobs openings came in at 7.051 M was below expectations of 7.186 M. Import export prices are trending lower.
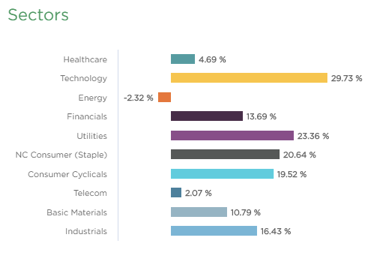
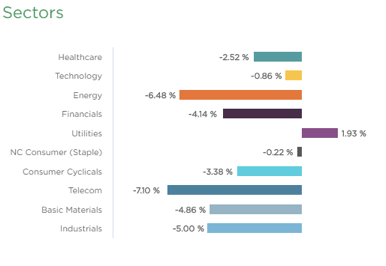
Sector performance:
Stock to Watch: None
Strongest groups are Mining-Gold/Silver, Insurance, Commercial services, Aerospace/Defense, Building Construction, Telecom
Weakest groups are Oil and Gas, Retail-Mall, Tobacco, Steel Producers, Food
Watch List: Our strong RS/Growth screen is showing following candidates.
CMG, PAGS, PCTY, TEAM, RNG, EPAM, FIVN, LULU, SEDG, NOC, IPHI, COST, CPRT, ESNT
Summary:
All-clear signal is still missing for investors. Be cautious but get ready with your list of stocks with strong fundamentals and high relative strength to act upon.