Markets broke minor supports last week and heading for testing August lows.
Markets may be range bound short term and mostly news driven.
Trump Administration is thinking of ways to limit investments into Chinese companies, including stripping Chinese firms from U.S. stock exchanges.
Trump Impeachment process started by Democrats in Congress may not be successful for lack of votes in Senate, unless public opinion changes for senators to switch sides.
Recap of last week:
Economic Reports:
| Economy Indicator | Released Date | Period | Prior | Prior Revised | Consensus | Actual |
| Chicago Fed National Activity | 9/23/2019 | Aug 2019 | -0.36 | -0.41 | -0.06 | -0.1 |
| PMI Composite Flash | 9/23/2019 | Sept 2019 | 50.9 | 51.2 | 51.0 | |
| Store Sales Y/Y Change | 9/24/2019 | WK 9/21, 2019 | 5.4 % | 5.2 % | ||
| Case Shiller HPI M/M Change | 9/24/2019 | July 2019 | 0.0 % | 0.1 % | 0.0 % | |
| Richmond Fed Mfg. Index | 9/24/2019 | Sept 2019 | 1 | -1 | -9 | |
| FHFA Housing Price Index M/M Change | 9/24/2019 | July 2019 | 0.2 % | 0.2 % | 0.4 % | |
| Consumer Confidence | 9/24/2019 | Sept 2019 | 135.1 | 134.2 | 133 | 125.1 |
| MBA Mortgage Applications W/W Change | 9/25/2019 | WK 9/20, 2019 | -0.1 % | -10.1 % | ||
| New Home Sales | 9/25/2019 | August 2019 | 635 K | 666 K | 662 K | 713 K |
| State Street Investor Confidence Index | 9/25/2019 | Sept 2019 | 75.9 | 76.8 | 80.1 | |
| Real GDP Q/Q Change | 9/26/2019 | Q2(f):2019 | 2.0 % | 2.0 % | 2.0 % | |
| International Trade in Goods Balance | 9/26/2019 | August 2019 | $-72.3 B | $-72.5 B | $-73.5 B | $-72.8 B |
| Jobless New Claims | 9/26/2019 | WK 9/21, 2019 | 208 K | 210 K | 211 K | 213 K |
| Corporate After-Tax Profits Y/Y change | 9/26/2019 | Q2(r):2019 | 1.7 % | 0.3 % | ||
| Retail Inventories M/M % change | 9/26/2019 | August 2019 | 0.8 % | 0.0 % | ||
| Wholesale Inventories M/M % change | 9/26/2019 | August 2019 | 0.2 % | 0.3 % | 0.4 % | |
| Pending Home Sales M/M Change | 9/26/2019 | August 2019 | -2.5 % | 0.6 % | 1.6 % | |
| Kansas City Fed Index | 9/26/2019 | Sept 2019 | -6 | -3 | -2 | |
| FED Balance Sheet | 9/26/2019 | WK 9/25, 2019 | $3.845 T | $3.858 T | ||
| Money Supply M2 Weekly Change | 9/26/2019 | WK 9/16, 2019 | $12.3 B | $10.4 B | ||
| Durable Goods Order M/M Change | 9/27/2019 | August 2019 | 2.1 % | 2 % | -1.2% | 0.2 % |
| Personal Income M/M change | 9/27/2019 | August 2019 | 0.1 % | 0.4 % | 0.4 % | |
| Consumer Spending M/M Change | 9/27/2019 | August 2019 | 0.6 % | 0.5 % | 0.3 % | 0.1 % |
| Consumer Sentiment | 9/27/2019 | Sept.(f) 2019 | 92 | 92 | 93.2 | |
| Baker-Hughes Rig Count | 9/27/2019 | WK 9/27, 2019 | 987 | 987 |
This week’s major events:
| Monday | Chicago PMI; Dallas Fed Mfg. Survey | ||
| Tuesday | Redbook; PMI Mfg.; ISM Mfg.; Construction spending | ||
| Wednesday | MBA Mortgage Applications; Motor Vehicles sales; ADP Employment Report | ||
| Thursday | Challenger Job cut Report; Jobless Claims; PMI Services Index; Factory Orders; ISM Non-Mfg. Index; FED Balance sheet; Money supply | ||
| Friday | Employment Situations; International Trade; Baker-Hughes Rig count |
Economy:
Consumer spending came in lower than anticipated at 0.1% growth for August. Also, capital goods spending dropped. GDP final reading for Q2 came in as expected at 2%.
A host of economic data is coming out next week, chief among the data is the monthly jobs report on Friday, which also includes the all-important earnings growth data. The consensus calls for 140,000 net new jobs, after last month’s lower than expected reading of 130,000.
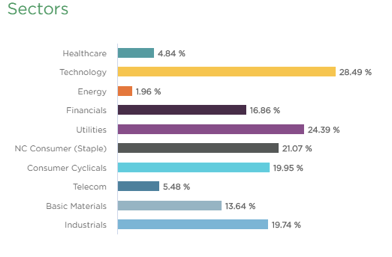
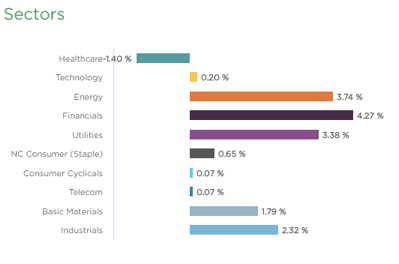
Sector performance:
Stock to Watch: None
Strongest groups are Mining-Gold/Silver, Energy-Solar, Retail Automobile, Aerospace/Defense, Building Construction, Telecom, Insurance, Semiconductor Equipment
Weakest groups are Oil and Gas, Retail-Mall, Tobacco, Steel Producers, Food
Watch List: Our strong RS/Growth screen is showing following candidates.
CMG, PAGS, PCTY, TEAM, RNG, EPAM, FIVN, LULU, SEDG, NOC, IPHI, COST, CPRT, ESNT
Summary:
Short-term indicators suggest caution near-term, but intermediate-term indicators are strong enough that any correction should be less substantial than that of August and should be relatively short-lived and transition to a rally to new highs in the weeks and months ahead. Trade lightly.