
The S&P was up 1.1% last week, just below the September 2018 all-time high. This could act as psychological barrier, short-term. Oil prices remain near recent highs.
Strong GDP growth with low inflation seems an ideal backdrop for the market. Google & Apple is reporting earnings on Monday & Tuesday. Uber might go public as early as this week with expected valuation around $90b, a very high market cap for a tech startup.
The market is in ‘Confirmed Up trend’. Our models are positive for intermediate & long trend.
Recap of last week:
Economic Reports:
| Economy Indicator | Released Date | Period | Prior | Prior Revised | Consensus | Actual |
| Chicago Fed National Activity | 4/22/2019 | March 19 | -0.29 | -0.31 | -0.15 | |
| Existing Home Sales | 4/22/2019 | March 19 | 5.551M | 5.480M | 5.300M | 5.210M |
| Redbook Store Sales Y/Y Change | 4/23/2019 | WK 4/20, 2019 | 5.0% | 6.0% | ||
| FHA Housing Price Index | 4/23/2019 | Feb 19 | 0.6% | 0.4% | 0.3% | |
| New Home Sales | 4/23/2019 | Apr 19 | 667K | 662K | 645k | 692K |
| Richmond Fed Mfg Index | 4/23/2019 | April 19 | 10 | 11 | 3 | |
| MBA Mortgage Applications W/W Change | 4/24/2019 | WK 4/19, 2019 | -3.5% | -7.3% | ||
| State Street Investor Confidence Index | 4/24/2019 | April 19 | 71.3 | 71.2 | 72.9 | |
| Durable Goods Order M/M Change | 4/25/2019 | March 19 | -1.6% | -1.1% | 0.7% | 2.7% |
| Jobless New Claims | 4/25/2019 | WK 4/20, 2019 | 192K | 193K | 209K | 230K |
| Kansas City Fed Index | 4/25/2019 | April 19 | 10 | 10 | 5 | |
| FED Balance Sheet | 4/25/2019 | WK 4/24, 2019 | $3.932T | $3.928T | ||
| Consumer Sentiment | 4/26/2019 | April 19 | 96.9 | 97.1 | 97.2 | |
| Baker-Hughes Rig Count | 4/26/2019 | Wk 4/26; 2019 | 1078 | 1054 |
This week’s major events:
| Monday | Personal Income & Outlays; Dallas FED Mfg Survey |
| Tuesday | FOMC Meeting |
| Wednesday | MBA Mortgage Applications; ADP Employment Report; PMI Mfg Index; Construction Spending; FOMC Announcement & Press Conference |
| Thursday | Motor Vehicle Sales; Jobless Claims; Challenger Job-Cut Report; Productivity & Costs; Factory Orders; FED Balance Sheet |
| Friday | Employment Situation; International Trade; Retail Inventories; Wholesale Inventories; PMI Services; ISM Non-Mfg Index; Baker-Hughes Rig count |
Economy:
GDP growth came in high at 3.2% for Q1, substantially high than consensus estimate of 2.3%. Durable Goods Orders for March came in at 2.7% annual rate, much higher than consensus at 0.8%. Treasury note yield remained low at 2.5% despite the strong economic numbers. Reason may be the low inflation figures. Personal Consumer Expenditures for last quarter came in at 0.8% annual rate, much lower than 1.3% expected.
The reports confirm the enviable situation the US economy is in right now.
The FED is meeting Tuesday and Wednesday of this week.
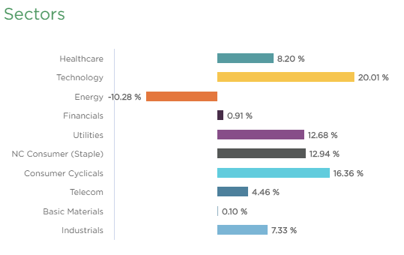
Sector performance YTD performance ending April 26, 2019:
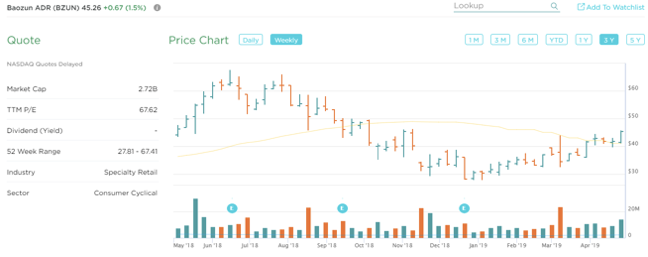
Stock to Watch: Baozun (BZUN)
Biozun is a Chinese-based company that provides end-to-end solutions to ecommerce business partners. It is in software-enterprise industry. As China-US trade war almost being settled shortly, valuations will start reflecting underlying fundamentals.
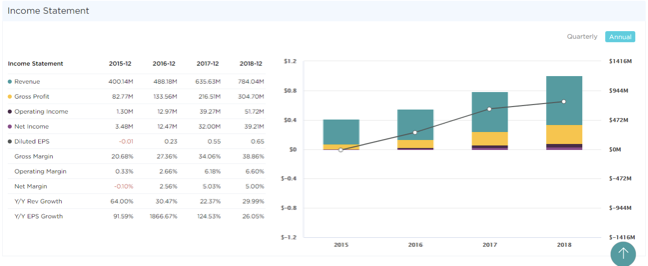
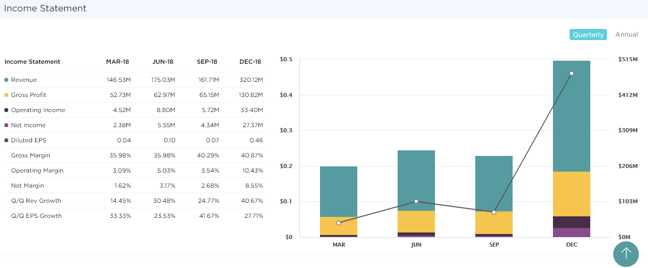
The Baozun has been growing 112% annually. Last few quarters sales growth has been 34%; 20%; 33% with EPS growth of 27%; 33%; 19%. Annual EPS in 2015 of $0.13 has grown to $0.84 in 2018. Estimated EPS growth for next two years is 52%. Gross margins have expanded from 20% to 38% range and ROE of 17%. Management owns 9% of shares outstanding.
Strongest groups are Software, Finance, Chips, Energy, Insurance, Computer-Tech services, Computer Software-enterprise, Computer Software-Database, Telecom, Computer Software-Security.
Weakest groups are Transport; Retail; Medical; Food.
Watch List: Our strong RS/Growth screen is showing following candidates. List is expanding this week. TEAM, CHGG, FN, PYPL, CYBR, BEAT, VRTX, FIVN, CASY, LLY, LULU, NOW, SAVE, HUBS, BA, FIVE, ADBE, INCY, ABMD, PANW, SSNC, ADSK, MSFT, HEIA, UBNT, TWLO, TTD, WDAY, ETSY, EPAM, ANET, MTCH, LPLA, FTNT, GDDY; AMZN, PAGS, ATHM, TWLO, BZUN
Summary:
Markets are near all-time high of September 2018 last week. We expect some sideways action to continue near term.