
S&P is making new high but most of the other indices are facing resistance zone here. Friday’s Job report was solid indicating strength of U. S. economy. Question now is ‘Will the FED cut rates at the end of this month and how much by January 2020?’
VIX closed below 14.40 level indicating volatility is behind us. Markets remain news driven. Let us be vigilant.
Leaders are acting well, and internals are positive for bias towards further rally ahead once the resistance zone is conquered.
The market is in Uptrend.
Recap of last week:
Economic Reports:
| Economy Indicator | Released Date | Period | Prior | Prior Revised | Consensus | Actual |
| PMI Mfg. Index | 7/1/2019 | June 2019 | 50.5 | 50.1 | 50.6 | |
| ISM Mfg. Index | 7/1/2019 | June 2019 | 52.1 | 51.1 | 51.7 | |
| Construction spending M/M Change | 7/1/2019 | May 2019 | 0.0% | 0.4% | 0.1% | -0.8% |
| Redbook Store Sales Y/Y Change | 7/2/2019 | WK 6/29, 2019 | 5.0% | 5.5% | ||
| Motor Vehicle Sales | 7/3/2019 | June 2019 | 17.3M | 17.4M | 17.0M | 17.3M |
| MBA Mortgage Applications W/W Change | 7/3/2019 | WK 6/28, 2019 | 1.3% | -0.1% | ||
| Challenger Job cut Report | 7/3/2019 | June 2019 | 58,577 | 41,977 | ||
| ADP Employment Report | 7/3/2019 | June 2019 | 27.000 | 41,000 | 140,000 | 102,000 |
| Trade Balance | 7/3/2019 | May 2019 | $-50.8B | $-51.2B | $-53.5B | $-55.5B |
| Jobless New Claims | 7/3/2019 | WK 6/29, 2019 | 227K | 229K | 220K | 221K |
| PMI Services Index | 7/3/2019 | June 2019 | 50.9 | 50.7 | 51.5 | |
| Factory Orders M/M Change | 7/3/2019 | May 2019 | -0.8% | -1.2% | -0.5% | -0.7% |
| ISM Non-Mfg. Index | 7/3/2019 | June 2019 | 56.9 | 55.8 | 55.1 | |
| Non-farm Payrolls M/M change | 7/5/2019 | June 2019 | 75,000 | 72,000 | 165,000 | 224,000 |
| Unemployment Rate | 7/5/2019 | June 2019 | 3.6% | 3.6% | 3.7% | |
| Private Payrolls M/M Change | 7/5/2019 | June 2019 | 90,000 | 83,000 | 149,000 | 191,000 |
| FED Balance Sheet | 7/5/2019 | WK 7/3, 2019 | $3.827T | $3.813T | ||
| Money Supply Weekly Change | 7/5/2019 | WK 6/24, 2019 | $27.0B | $26.9B | $19.5B |
This week’s major events:
| Monday | Consumer Credit | ||
| Tuesday | NFIB Small Business Optimism Index; Redbook; JOLTS Report | ||
| Wednesday | MBA Mortgage Applications; Atlanta Fed Business Inflation Expectations; Wholesale Trade; FOMC Minutes; FED Chairman Powell testimony to the House. | ||
| Thursday | CPI; Jobless Claims; FED Balance Sheet; Money Supply; FED Chairman Powell testimony to the Senate. | ||
| Friday | PPI-FD; Baker-Hughes Rig Count | ||
Economy:
US Economy is solid. Economy added 224,000 jobs in June, a big upside surprise against expectations of 165,000 new jobs. This is solid but moderate slowdown from 223,000 average monthly gain in 2018. The solid data reduced chances for half-point fed rate cut at the end of July. Slowing wage growth and China trade war uncertainty still support the case for quarter point cut.
The unemployment rate ticked up to 3.7% but with increased participation rate, which is good news.
Average hourly wage growth slowed. The monthly gain of 0.2% came short of expectations of 0.3%. The trend is worrisome. For the first half of this year, wage growth saw deceleration to an annualized 2.7% rate vs. 3.3% in 2018.
Markets still are expecting three Fed rate cuts by January.
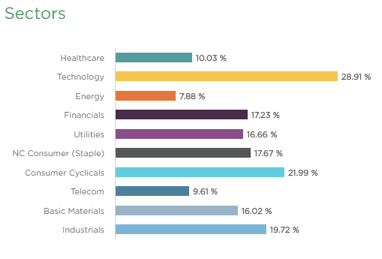
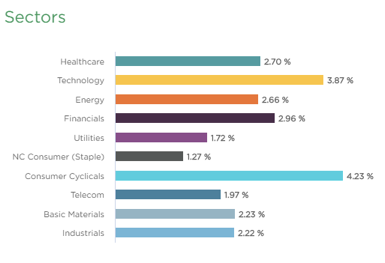
Sector performance:
Stock to Watch: EPAM Systems (EPAM)
EPAM Systems is a provider of outsourced IT and LIFECYCLE software development services.
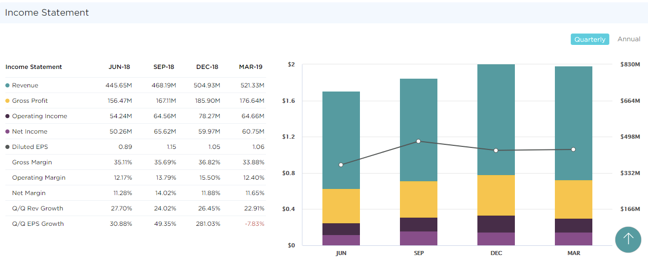
EPAM has been growing 25% annually. Last few quarters sales growth has been 27%; 26%; 23% with EPS growth of 31%; 49%; 281%. Annual EPS in 2015 of $2.47 has grown to $4.38 in 2017. Estimated EPS growth for next two years is 20%. It has seen growth in equity steadily for past four years. Net margins have been in mid-thirties and ROE of 22%. Management owns 5% of shares outstanding.
EPAM has been early leader in current cycle with strong relative strength gaining over 80% within five months. It is an ideal time to buy EPAM as it forms a flat base of price consolidation of 9 weeks.
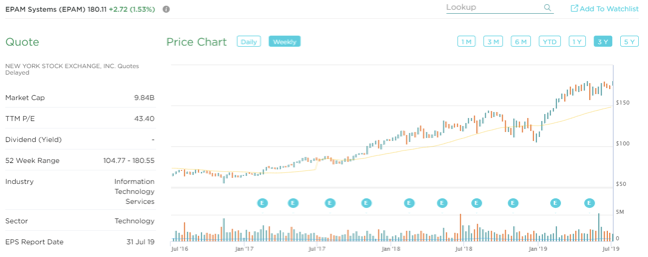
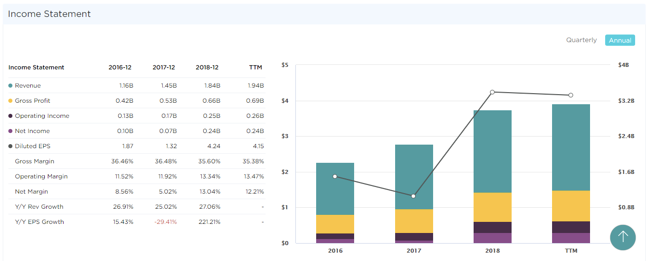
Chart 4. Annual Income & Margin trends for EPAM. Courtesy www.Vistalytics.com
Strongest groups are Energy, Software, Insurance, Business service, Insurance, Computer-Tech services, Computer Software-enterprise, Computer Software-Database, Telecom, Computer Software-Security.
Weakest groups are Retail, Food, Auto, Media, Medical
Watch List: Our strong RS/Growth screen is showing following candidates.
TEAM, CHGG, PYPL, CYBR, FIVN, SHOP, LLY, LULU, NOW, HUBS, FIVE, ADBE, ADSK, MSFT, HEIA, TWLO, WDAY, ETSY, EPAM, MTCH, LPLA, GDDY; AMZN, PAGS, FB, FNKO, BAH, CPRT, ENTH, HEI, LLL, PAYC, PGR, PODD, VEEV, VRSN, KL, GNRC, CACC, AMD, MDSO, BZUN
Summary:
Resistance is being challenged here. All eyes are on FED this week with FED Chairman testify to House on Wednesday and to Senate on Thursday about the economy. Look out for strong RS stocks and add early leaders or new ones that are emerging here.