
The stock market overcame resistance on both major indices and closed at new highs. Economic news was good. FED cut interest rate, economy added 128,000 jobs in October and GDP grew 1.9% in Q3.
Earnings reports are coming favorably helping stocks to move up from sound bases built over last two months. Background news are generally positive. Impeachment news is not a factor for now. We expect market to move up ahead as we leave seasonally weak period behind.
Recap of last week:
Economic Reports:
| Economy Indicator | Released Date | Period | Prior | Prior Revised | Consensus | Actual |
| International Trade in Goods Balance | 10/28/2019 | Sept 2019 | $-72.8 B | $-73.1 B | $-73.5 B | $-70.4 B |
| Wholesale Inventories M/M % change | 10/28/2019 | Sept 2019 | 0.4 % | 0.0 % | 0.2 % | -0.3 % |
| Retail Inventories M/M % change | 10/28/2019 | Sept 2019 | 0.0 % | -0.2 % | 0.3 % | |
| Dallas Fed Mfg. Survey | 10/28/2019 | October 2019 | 13.9 | 4.5 | ||
| Store Sales Y/Y Change | 10/29/2019 | WK 10/26, 2019 | 4.3 % | 4.5 % | ||
| Case Shiller HPI M/M Change | 10/29/2019 | August 2019 | 0.0 % | -0.1 % | -0.2 % | |
| Consumer Confidence | 10/29/2019 | October 2019 | 125.1 | 126.3 | 128.8 | 125.9 |
| Pending Home Sales M/M Change | 10/29/2019 | Sept 2019 | 1.6% | 0.7 % | 1.5 % | |
| MBA Mortgage Applications W/W Change | 10/30/2019 | WK 10/25, 2019 | -11.9 % | 0.6 % | ||
| ADP Employment Report | 10/30/2019 | October 2019 | 135,000 | 93,000 | 125,000 | 125,000 |
| Real GDP Q/Q Change | 10/30/2019 | Q3(a):2019 | 2.0 % | 1.7 % | 1.9 % | |
| State Street Investor Confidence Index | 10/30/2019 | October 2019 | 80.1 | 79.2 | ||
| Business Uncertainty Index | 10/30/2019 | October 2019 | 90.2 | 93.0 | 95.0 | |
| Federal Funds Rate | 10/30/2019 | October 2019 | 1.75 to 2.00 % | 1.625 % | 1.50 to 1.75 % | |
| Challenger Job cut Report | 10/31/2019 | October 2019 | 41,557 | 50,275 | ||
| Jobless New Claims | 10/31/2019 | WK 10/26, 2019 | 212 K | 213 K | 215 K | 218 K |
| Personal Income M/M change | 10/31/2019 | Sept 2019 | 0.4 % | 0.5 % | 0.3 % | 0.3 % |
| Consumer Spending M/M Change | 10/31/2019 | Sept 2019 | 0.1 % | 0.2 % | 0.2 % | 0.2 % |
| Employment Cost Index Q/Q change | 10/31/2019 | Q3: 2019 | 0.6 % | 0.7 % | 0.7 % | |
| Chicago PMI | 10/31/2019 | October 2019 | 47.1 | 48.3 | 43.2 | |
| FED Balance Sheet | 10/31/2019 | WK 10/30, 2019 | $3.969 T | $4.020 T | ||
| Money Supply M2 Weekly Change | 10/31/2019 | WK 10/21, 2019 | $15.2 B | $43.1 B | ||
| Non-farm Payrolls M/M change | 11/1/2019 | October 2019 | 136,000 | 180,000 | 90,000 | 128,000 |
| Private Payrolls M/M Change | 11/1/2019 | October 2019 | 114,000 | 167,000 | 90,000 | 131,000 |
| Average Hourly Earnings M/M change | 11/1/2019 | October 2019 | 0.0 % | 0.2 % | 0.2 % | |
| Average Workweek | 11/1/2019 | October 2019 | 34.4 hrs. | 34.4 hrs. | 34.4 hrs. | |
| PMI Mfg. Index | 11/1/2019 | October 2019 | 51.1 | 51.3 | ||
| ISM Mfg. Index | 11/1/2019 | October 2019 | 47.8 | 49.3 | 48.3 | |
| Construction spending M/M Change | 11/1/2019 | October 2019 | 0.1 % | -0.3 % | 0.2 % | 0.5 % |
| Baker-Hughes Rig Count | 11/1/2019 | WK 11/1, 2019 | 977 | 964 |
This week’s major events:
| Monday | Motor vehicles sales; Factory Orders; TD Ameritrade IMX index | ||
| Tuesday | International Trade; Redbook; PMI Services; ISM non-mfg. Index; JOLTS | ||
| Wednesday | MBA Mortgage Applications; Productivity and costs | ||
| Thursday | Jobless Claims; Consumer Credit; FED Balance sheet; Money Supply | ||
| Friday | Consumer sentiment; Wholesale Trade; Baker-Hughes Rig count |
Economy:
Economy added 128,00 jobs in October, despite General Motors strike. Job participation rate came in at six year high of 63.3%. FED lowered its benchmark interest rate by 0.25% Wednesday but hinted this could be the last one for now. Yield curve is no more inverted. GDP grew 1.9% in Q3A resilient consumer helped the economy to expand more than forecast in third quarter, offsetting weak business investment and exports. Consumer spending grew healthy up 2.9% with wage growth of 3%.
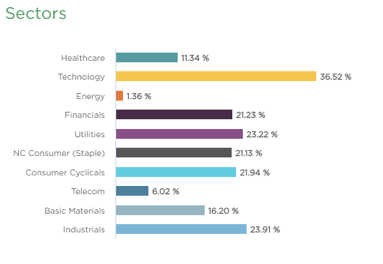
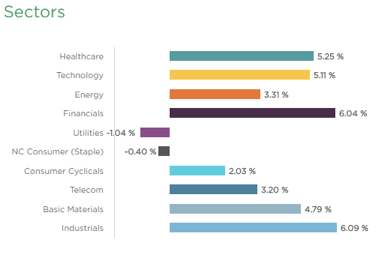
Sector performance:
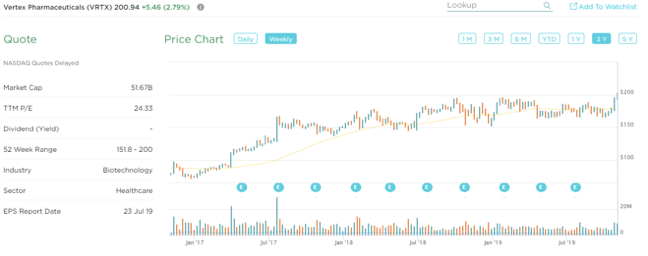
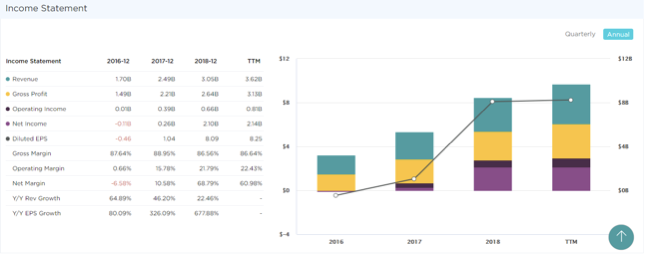
Stock to Watch: Vertex Pharmaceuticals (VRTX)
Vertex Pharmaceuticals develops and commercialize therapies for Cystic Fibrosis.
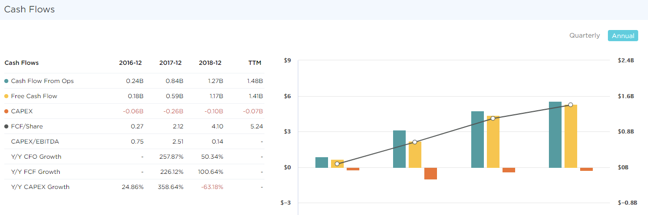
Vertex has good track record in the industry with annual growth over 100 percentages. ROE of 33% and sales growth of 34%; 34%; 25% and 21% in past four quarters. Earnings growth is 110%; 50%; 34% and 13% for the same period. Expected annual earnings growth for 2020 is 38%. Gross margins are in high eighties consistently. Annual operating cash flow is moving up nicely. Annual Cash flow/share has jumped from $0.27 to $5.24 in past four years. Institutional participation has increased steadily from 1917 to 2043. It has stream of products in the pipeline for FDA approval.
Technically, its is coming out of a long consolidation over two years. We expect price appreciation to continue near term and over next two years.
Strongest groups are Retail-home furnishings, Semiconductor-equipment, Insurance, Commercial services-document management, Telecom-services
Weakest groups are Oil and Gas, Retail-Mall, Tobacco, Telecom-infrastructure, Food
Watch List: Our strong RS/Growth screen is showing following candidates.
CMG, PAGS, PCTY, TEAM, RNG, EPAM, FIVN, LULU, SEDG, NOC, IPHI, COST, CPRT, ESNT, KEYS, VRTX, RDN, PODD
Summary:
Markets are having positive environment after turbulent six months. Many stocks are acting well. Demand gauge is lacking for now. We need to watch next week if the follow thru continues with higher volume. Prudent participation is recommended.