
HAPPY THANKSGIVING!!!
All three major indices are holding up well trading above 10DMA despite low volatility. Economic news was good. The Philly Fed Manufacturing survey was strong 10.4 actual vs 7 estimated. Leading economic indicators fell in October by 0.1% vs 0.2% drop expected.
Santa Claus rally continues with many reasons. Earnings picture looks bright. Leaders are making highs. Inflation is low. Economy is doing fine. Investor’s sentiment is not extreme. Market internals are good.
Equities may continue to trend higher through a seasonally strong end-of-year period. Stock volatility is low, and history tells us things won’t stay calm forever, so investors consider preparing for periodic volatility.
Recap of last week:
Economic Reports:
| Economy Indicator | Released Date | Period | Prior | Prior Revised | Consensus | Actual |
| Housing Market Index | 11/18/2019 | November 2019 | 71 | 71 | 70 | |
| Foreign Demand for LT US Securities | 11/18/2019 | Sept 2019 | -$41.2 B | -$41.2 B | $49.5 B | |
| Housing Starts | 11/19/2019 | October 2019 | 1.256 M | 1.266 M | 1.320 M | 1.314 M |
| Housing Permits | 11/19/2019 | October 2019 | 1.387 M | 1.391 M | 1.378 M | 1.461 M |
| Store Sales Y/Y Change | 11/19/2019 | WK 11/16, 2019 | 5.0 % | 4.1 % | ||
| E-Commerce Sales Q/Q Change | 11/19/2019 | Q3:2019 | 4.2 % | 4.8 % | 5.0 % | |
| MBA Mortgage Applications W/W Change | 11/20/2019 | WK 11/15, 2019 | 9.6 % | -2.2 % | ||
| Jobless New Claims | 11/21/2019 | WK 11/16, 2019 | 225 K | 227 K | 217 K | 227 K |
| Philadelphia FED Business Outlook | 11/21/2019 | November 2019 | 5.6 | 7 | 10.4 | |
| Existing Home Sales | 11/21/2019 | October 2019 | 5.380 M | 5.360 M | 5.480 M | 5.460 M |
| Leading Indicators | 11/21/2019 | October 2019 | -0.1 % | -0.2 % | -0.2 % | -0.1 % |
| FED Balance Sheet | 11/21/2019 | WK 11/20, 2019 | $4.048 T | $4.030 T | ||
| Money Supply M2 Weekly Change | 11/21/2019 | WK 11/11, 2019 | $25 B | $35.5 B | $15.9 B | |
| PMI Mfg. Index | 11/21/2019 | November 2019 | 51.3 | 51.2 | 51.9 | |
| Consumer Sentiment | 11/22/2019 | Nov(f) 2019 | 95.7 | 95.7 | 96.8 | |
| Kansas City Fed Mfg. Index | 11/22/2019 | November 2019 | -3 | -3 | ||
| Baker-Hughes Rig Count | 11/22/2019 | WK 11/22, 2019 | 940 | 940 |
This week’s major events:
| Monday | Chicago FED National Activity; Dallas Fed Mfg. Survey; FED Chairman speaks | ||
| Tuesday | International Trade in goods; Retail Inventories; Wholesale inventories; Redbook; New Home sales; Consumer confidence; Richmond FED Mfg. Index | ||
| Wednesday | MBA Mortgage Applications; Durable Goods order; GDP; Jobless Claims; Corporate profits; Personal Income and outlays | ||
| Thursday | Thanksgiving Holiday | ||
| Friday | Chicago PMI; Money Supply; FED Balance sheet |
Economy:
Economic news was positive. Economic news was good. The Philly Fed Manufacturing survey was strong 10.4 actual vs 7 estimated. Leading economic indicators fell in October by 0.1% vs 0.2% drop expected.
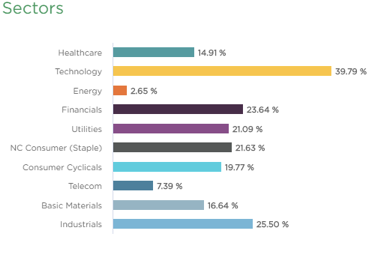
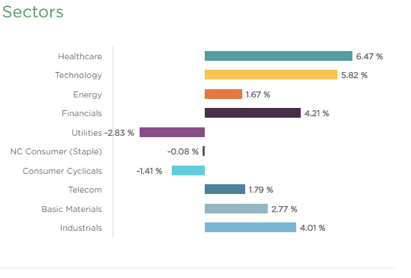
Sector performance
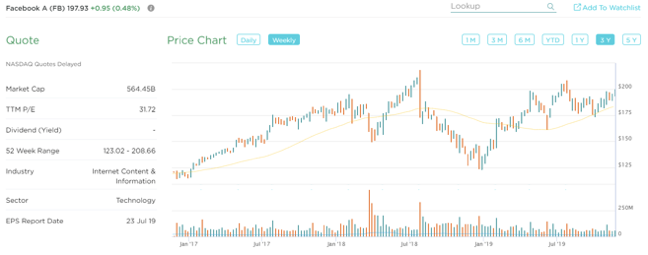
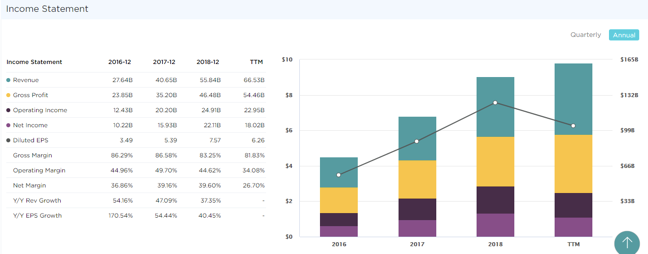
Stock to Watch: Facebook Inc. (FB)
Facebook is world’s largest online social network company with over 2 billion monthly active users.
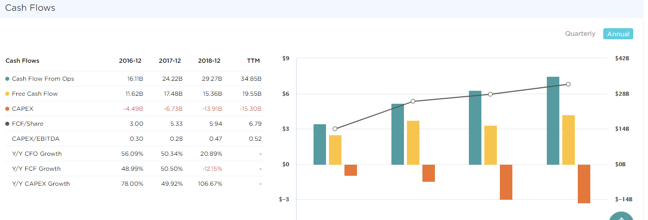
Facebook is dominant in the industry with annual growth over 52 percentages. ROE of 28% and sales growth of 30%; 26%; 28% and 29% in past four quarters. Gross margins are in eighties consistently. Net margins are 29 percentages even after high expenses in recent year. FCF/Share has doubled from $3 to $6.80 over last four years. Institutional participation has increased steadily from 3880 to 4550. Major leading funds like Fidelity, T. Row Price and Vanguard has high percentages of the assets in this technology giant.
Technically, it is coming out of a long consolidation of eighteen months. We expect price appreciation to continue near term and over next year.
Strongest groups are Semiconductor-equipment, Semiconductor Manufacturing, Retail-home furnishings, Elect-Contract Manufacturing, Auto Manufacturers, Building construction Products
Weakest groups are Oil and Gas, Retail-Mall, Food-Beverages, Tobacco, Telecom-infrastructure
Watch List: Our strong RS/Growth screen is showing following candidates.
PCTY, RNG, EPAM, FIVN, LULU, NOC, IPHI, COST, CPRT, ESNT, KEYS, VRTX, RDN, PODD, CMG, FTNT, FISV, GOOGL, MSFT, NMIH, NTES, INCY, BABA, DOCU, ARES, FB, STNE, NOW
Summary:
Santa Claus rally continues. Equities may continue to trend higher through a seasonally strong end-of-year period. Stock volatility is calming, and history tells us things won’t stay calm forever, so investors consider preparing for periodic volatility and risk management. Prudent increase in participation is recommended.