
All three major indices made new highs. Trade deal seems to be close as per statements from Presidential Economic Advisor Larry Kudlow. Economic news was good. . Retail sales reports came in favorably helping stocks to move up.
It’s beginning to look a lot like a Santa Claus rally as the S&P 500 pushes toward its ninth record high in three weeks. It hasn’t posted two consecutive declines for 27 trading days, the longest streak since January 2012. Stocks have crept higher in an unusually calm fashion, with S&P 500 trading in a range smaller than 1% in twenty-four trading sessions
Equities may continue to trend higher through a seasonally strong end-of-year period, especially after a breakthrough on trade and geopolitical front. Stock volatility is calming, and history tells us things won’t stay calm forever, so investors consider preparing for periodic volatility.
Recap of last week:
Economic Reports:
| Economy Indicator | Released Date | Period | Prior | Prior Revised | Consensus | Actual |
| Small Business Optimism Index | 11/12/2019 | October 2019 | 101.8 | 102 | 102.4 | |
| Store Sales Y/Y Change | 11/12/2019 | WK 11/9, 2019 | 5.5 % | 5.0 % | ||
| MBA Mortgage Applications W/W Change | 11/13/2019 | WK 11/8, 2019 | -0.1% | 9.6% | ||
| CPI M/M Change | 11/13/2019 | October 2019 | 0.0% | 0.3% | 0.4% | |
| CPI Y/Y Change | 11/13/2019 | October 2019 | 1.7% | 1.7% | 1.8% | |
| Atlanta Fed Business Infl. Expectations % Yr/Yr | 11/13/2019 | October 2019 | 1.8 % | 2.0% | ||
| Treasury Budget level | 11/13/2019 | October 2019 | $82.2 B | -$130 B | -$134.5 B | |
| Jobless New Claims | 11/14/2019 | WK 11/9, 2019 | 211 K | 215 K | 225 K | |
| PPI FD M/M Change | 11/14/2019 | October 2019 | -0.3 % | 0.3 % | 0.4 % | |
| PPI FD Y/Y Change | 11/14/2019 | October 2019 | 1.4 % | 0.9 % | 1.1 % | |
| FED Balance Sheet | 11/14/2019 | WK 11/13, 2019 | $4.039 T | $4.048 T | ||
| Money Supply M2 Weekly Change | 11/14/2019 | WK 11/04, 2019 | $39.6 B | $39.5 B | $25 B | |
| Retail Sales M/M change | 11/15/2019 | October 2019 | -0.3% | 0.2% | 0.3% | |
| Retail Sales less autos M/M change | 11/15/2019 | October 2019 | -0.1% | 0.4% | 0.2% | |
| Empire State Mfg. Survey | 11/15/2019 | November 2019 | 4 | 5 | 2.9 | |
| Business Inventories M/M Change | 11/15/2019 | Sept 2019 | 0.0 % | -0.1 % | 0.1% | -0.2 % |
| Import Prices M/M Change | 11/15/2019 | October 2019 | 0.2% | 0.1 % | -0.2% | -0.5% |
| Export Prices M/M Change | 11/15/2019 | October 2019 | -0.2% | -0.1% | -0.1% | |
| Import Prices Y/Y Change | 11/15/2019 | October 2019 | -1.6% | -2.1 % | -2.1 % | -3.0% |
| Export Prices Y/Y Change | 11/15/2019 | October 2019 | -1.6% | -1.3% | -2.2% | |
| Industrial Production M/M Change | 11/15/2019 | October 2019 | -0.4% | -0.3% | -0.4% | -0.8% |
| Manufacturing M/M Change | 11/15/2019 | October 2019 | -0.5% | -0.5% | -0.6% | |
| Capacity Utilization Rate Level | 11/15/2019 | October 2019 | 77.5% | 77.2% | 76.7% | |
| Baker-Hughes Rig Count | 11/15/2019 | WK 11/15, 2019 | 957 | 940 |
This week’s major events:
| Monday | Housing Market; Treasury International Capital | |
| Tuesday | Housing starts; Redbook; Quarterly Service Report; E-Commerce Retail sales | |
| Wednesday | MBA Mortgage Applications; FOMC Minutes | |
| Thursday | Jobless Claims; Philadelphia FED Business Outlook; Existing Home sales; Leading Indicators; FED Balance Sheet; Money Supply | |
| Friday | PMI; Consumer Sentiment; Kansas City Fed Mfg.; Baker-Hughes Rig Count |
Economy:
Economic news was positive. Retail sales rose 0.3% in October, topping expectations, the Commerce Department reported Friday. Yet excluding autos, sales rose a softer-than-expected 0.2%. The data, following a decline in September sales, somewhat undercut the picture of a strong consumer. Job report is doing fine. Economic gauges are not signaling sign of recession. Market has come to terms with FED and moving up.
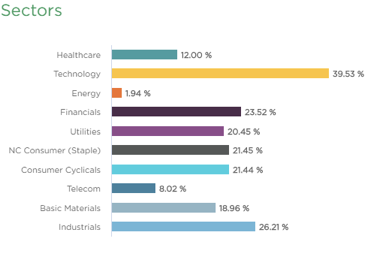
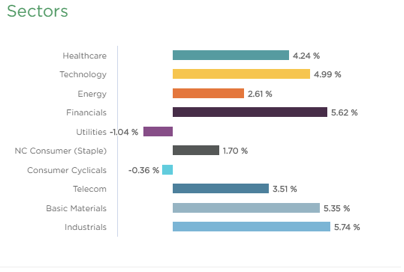
Sector performance:
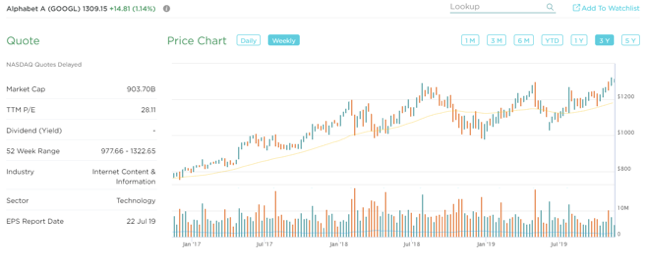
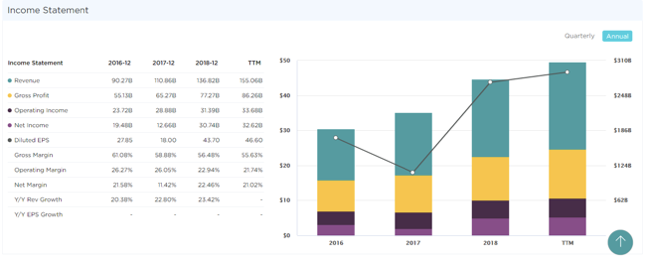
Stock to Watch: Alphabet Inc. (GOOGL)
Alphabet is a holding company, with Google, internet media giant. Google generates 99% of Alphabet revenue.
Alphabet is well stablished company still with decent annual growth over 23 percentages. ROE of 20% and sales growth of 22%; 17%; 19% and 20% in past four quarters. Gross margins are in high- fifties consistently. Net margins are 21 percentages. Institutional participation has increased steadily from 4580 to 4980. Major leading funds like Fidelity, T. Row Price and Vanguard has high percentages of the assets in this technology giant.
Technically, it is coming out of a long consolidation of fourteen months. We expect price appreciation to continue near term and over next year.
Strongest groups are Semiconductor-equipment, Semiconductor Manufacturing, Retail-home furnishings, Chemical paints, Auto Manufacturers, Building construction Products
Weakest groups are Oil and Gas, Retail-Mall, Food-Beverages, Tobacco, Telecom-infrastructure
Watch List: Our strong RS/Growth screen is showing following candidates.
PCTY, RNG, EPAM, FIVN, LULU, NOC, IPHI, COST, CPRT, ESNT, KEYS, VRTX, RDN, PODD, CMG, PAGS, FTNT, FISV, GOOGL, MSFT, NMIH, JD, INCY, BABA, DOCU, ARES, FB
Summary:
It’s beginning to look a lot like a Santa Claus rally as the S&P 500 pushes toward its ninth record high in three weeks. Equities may continue to trend higher through a seasonally strong end-of-year period, especially after a breakthrough on trade and geopolitical front. Stock volatility is calming, and history tells us things won’t stay calm forever, so investors consider preparing for periodic volatility and risk management. Prudent increase in participation is recommended.