
Market have shown record performance since bottoming in late December. It has overcome important resistances at 50DMA & 200 DMA with ease. Next resistance zone for NASDAQ is 7570-7650 & for SPX zone is 2800-2815. We will not be surprised that market will overcome these zones in next week or so. But one should be prepared for some pullbacks as well. The market is in confirmed rally. Background news on US-China trade deal is positive. FED is not in a hurry to raise rates in spite of strong economy.
Recap of last week:
Economic Reports:
| Economy Indicator | Released Date | Period | Prior | Prior Revised | Consensus | Actual |
| Housing Market Index | 2/19/2019 | Feb-19 | 58 | 59 | 62 | |
| Red Book Store Sales Y/Y change | 2/20/2019 | wk2/16 2019 | 4.6% | 5.4% | ||
| Durable Goods Order M/M cange | 2/21/2019 | Dec-18 | 0.8% | 0.7% | 1.0% | 1.2% |
| Jobless Claims | 2/21/2019 | Wk2/16:2019 | 239k | 225k | 216k | |
| Existing Home Sales M/M change | 2/21/2019 | Jan-19 | -6.4% | -4.0% | -1.2% | |
| Leading Indicators M/M change | 2/21/2019 | Jan-19 | -0.1% | 0.0% | 0.1% | -0.1% |
| Baker Hughes Rig count | 2/22/2019 | Wk2/22:2019 | 1051 | 1047 |
This week’s major events:
| Monday | Chicago Fed National Activity; Wholesale Trade |
| Tuesday | Housing Starts; Redbook; Case Shiller HPI; Consumer Confidence; Richmond Fed Mfg |
| Wednesday | Factory orders; Retail Inventories; Wholesale Inventories |
| Thursday | GDP; Jobless Claims; Chicago PMI |
| Friday | Personal Income & Outlays; PMI Mfg Index; ISM Mfg Index; Consume sentiment |
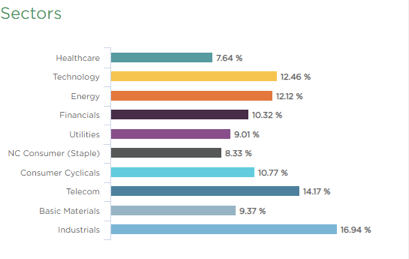
Sector performance YTD ending Feb 22, 2019:
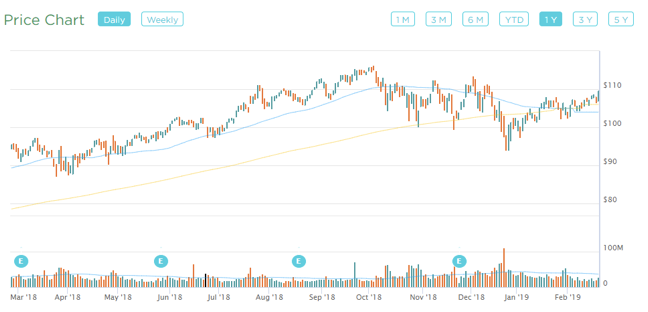
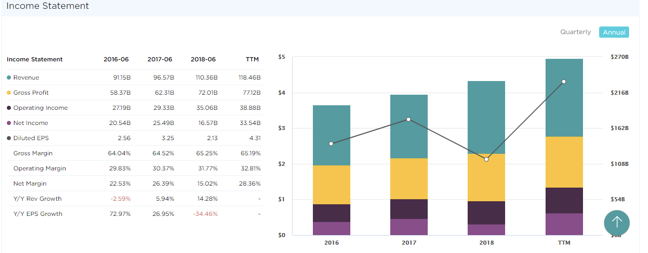
Stock to Watch: Microsoft Corp
This week we highlight Microsoft Corporation (MSFT). Develops operating systems, Business software, Applications for Servers. It has an annual growth rate of 11%. Return on Equity is 38%. Its Gross Margins are 65%. Net Margins have expanded steadily from 22% to 28%. In past few quarters, EPS has been growing (7%;38%;15%) with Sales growth for past few quarters (17%; 19%; 12%). This year 2019 EPS estimates are indicating growth of 14%. Insider buyers have been buying in last six months. This is a solid big cap technology company with potential price appreciation in next two years.
In recent market correction, stock had held up well and showing strength. Stock is a buy here.
Strongest groups are Mining, Insurance, Computer-Tech services, Computer Software-enterprise, Computer Software-Database, Telecom, Computer Software-Security.
Weakest groups are Retail; Energy; Food.
Watch List: Our strong RS/Growth screen is showing following candidates. List is expanding this week.
TEAM, CHGG, FN, PYPL, CYBR, BEAT, VRTX, FIVN, CASY, LLY, LULU, NOW, SAVE, HUBS, BA, FIVE, ADBE, MLNX, INCY, ABMD, PANW, SSNC, ADBE, ADSK, MSFT, HEIA
Summary:
Markets are challenging resistance zone. More leaders are participating in the rally. It’s ok to add exposure to strong groups.