
Markets are range bound with resistance here and support at August 5 lows. Depending on the news it’s moving between these levels. We must watch the test of August 5 lows ahead. Character of the test will determine what should we expect in next coming weeks. Volatility index still high and needs to come down below 15 for market to find legs again.
Essentially, fundamentally nothing has changed since last week.
This market is news driven and it has the potential to turn ugly. Protecting capital should be the focus while watching developments ahead.
Recap of last week:
Economic Reports:
| Economy Indicator | Released Date | Period | Prior | Prior Revised | Consensus | Actual |
| Durable Goods Order M/M Change | 8/26/2019 | July 2019 | 2.0% | 1.8% | 1.2% | 2.1% |
| Chicago Fed National Activity | 8/26/2019 | July 2019 | -0.02 | -0.03 | 0.00 | -0.36 |
| Dallas Fed Mfg. Survey | 8/26/2019 | August 2019 | 9.3 | 17.9 | ||
| Redbook Store Sales Y/Y Change | 8/27/2019 | WK 8/24, 2019 | 4.9% | 5.7% | ||
| Case Shiller HPI M/M Change | 8/27/2019 | June 2019 | 0.1% | 0.2% | 0.0% | |
| FHFA Housing Price Index M/M Change | 8/27/2019 | June 2019 | 0.1% | 0.2% | 0.3% | 0.2% |
| Richmond Fed Mfg. Index | 8/27/2019 | August 2019 | -12 | -4 | 1 | |
| MBA Mortgage Applications W/W Change | 8/28/2019 | WK 8/23, 2019 | -0.9% | 6.2% | ||
| Consumer Confidence | 8/27/2019 | August 2019 | 135.7 | 135.8 | 130 | 135.1 |
| State Street Investor Confidence Index | 8/28/2019 | August 2019 | 84.9 | 84.6 | 75.9 | |
| Real GDP Q/Q Change | 8/29/2019 | Q2:2019 | 2.1% | 2.0% | 2.0% | |
| International Trade in Goods Balance | 8/29/2019 | July 2019 | $-74.2B | $-74.4B | $-72.3B | |
| Jobless New Claims | 8/29/2019 | WK 8/24, 2019 | 209 K | 211 K | 213 K | 215 K |
| Wholesale Inventories M/M % change | 8/29/2019 | July 2019 | 0.2% | 0.0% | 0.2% | |
| Retail Inventories M/M % change | 8/29/2019 | July 2019 | -0.1% | -0.3% | 0.8% | |
| Pending Home Sales M/M Change | 8/29/2019 | July 2019 | 2.8% | -0.3% | -2.5% | |
| FED Balance Sheet | 8/29/2019 | WK 8/28, 2019 | $3.765T | $3.760T | ||
| Money Supply M2 Weekly Change | 8/29/2019 | WK 8/19, 2019 | $14.6B | $-5.0B | ||
| Personal Income M/M change | 8/30/2019 | July 2019 | 0.4% | 0.5% | 0.3% | 0.1% |
| Consumer Spending M/M Change | 8/30/2019 | June 2019 | 0.3% | 0.5% | 0.6% | |
| Chicago PMI | 8/30/2019 | August 2019 | 44.4 | 47.5 | 50.4 | |
| Consumer Sentiment | 8/30/2019 | August 2019 | 92.1 | 92.3 | 89.8 | |
| Baker-Hughes Rig Count | 8/30/2019 | WK 8/30, 2019 | 1055 | 1054 |
This week’s major events:
| Monday | Holiday | ||
| Tuesday | PMI Manufacturing; ISM Manufacturing; Construction Spending | ||
| Wednesday | MBA Mortgage Applications; International Trade; Redbook; Beige Book | ||
| Thursday | Challenger Job cuts Report; ADP Employment Report; Jobless Claims; Productivity and costs; PMI Services; Factory Orders; ISM Non-Mfg. Index; FED Balance Sheet; Money Supply | ||
| Friday | Employment situation; Quarterly Services Survey; Mr. Powell Speaks; Baker-Hughes Rig count |
Economy:
Week was lighter on economic reports. FED Chair’s speech on Friday at Jackson Hole was promising for future rate cuts. Same cannot be said about China trade war. Chinese put more tariffs effective September 1, 2019. Mr. Trump announced he will retaliate and encouraged companies not to do business in China. But then again, on Monday both sides are stating as if they are ready to make a deal. This kind of talk has gone back and forth many times before. Real progress is missing and as we said earlier market needs proof. President’s Economic Advisor, Mr. Kudlow, indicated prospect of tax cuts before election 2020.
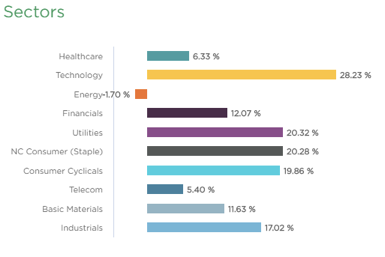
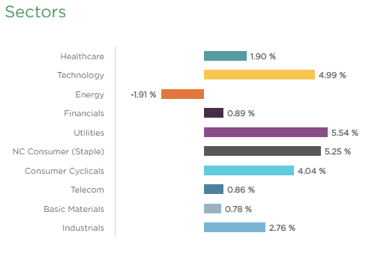
Sector performance:
Stock to Watch: None
Strongest groups are Energy-Solar, Mining-Gold/Silver, Utilities, Computer-Tech services, Computer Software-enterprise, Consumer Services-Education, Insurance, Aerospace/Defense, Computer Software-Security.
Weakest groups are Oil and Gas, Retail-Mall, Food, Auto, Media, Chemicals-Basic
Watch List: Our strong RS/Growth screen is showing following candidates.
CMG, TTD, OLED, PAGS, PAYC, PCTY, TEAM, VEEV, HEI, RNG, EPAM, SHOP, FIVN, LULU, V
Summary:
Major indexes are range bound with resistance at 50DMA and support at August 5, 2019 lows. Market is hoping but lacks confidence for any progress in near future on China-US trade issues and is concerned about global economy. This week was typical example of news driven market. Wait for better environment to tip your toes back in.