
As we expected, volatility has returned. Markets are down this week -2% on Nasdaq & 1.3% on SP500. This is after healthy gains since October 2019. We expect to see support coming in near 50DMA. This correction was overdue and healthy for the intermediate term trend. Global central banks are pro-active in minimizing the effect of Coronavirus on the economy. China has already started pumping liquidity into the system. Expect next phase of the market to show signs of bubbles developing. This pullback is ideal time to align oneself for right instruments for coming weeks. Dollar and Gold are advancing.
Intermediate term indicators are positive.
Recap of last week:
Economic Reports:
| Economy Indicator | Released Date | Period | Prior | Prior Revised | Consensus | Actual |
| Empire State Mfg. Survey | 2/18/2020 | February 2020 | 4.8 | 4 | 12.9 | |
| Housing Market Index | 2/18/2020 | February 2020 | 75 | 75 | 74 | |
| Foreign Demand for LT US Securities | 2/18/2020 | December 2019 | $22.9 B | $27.1 B | $85.6 B | |
| MBA Mortgage Applications W/W Change | 2/19/2020 | WK 2/14, 2020 | 1.1 % | -6.4 % | ||
| Housing Starts | 2/19/2020 | January 2020 | 1.608 M | 1.626 M | 1.420 M | 1.567 M |
| Housing Permits | 2/19/2020 | January 2020 | 1.416 M | 1.420 M | 1.453 M | 1.551 M |
| PPI FD M/M Change | 2/19/2020 | January 2020 | 0.3 % | 0.2 % | 0.1 % | 0.5 % |
| PPI FD Y/Y Change | 2/19/2020 | January 2020 | 1.3 % | 1.7 % | 2.1 % | |
| Store Sales Y/Y Change | 2/19/2020 | WK 2/15, 2020 | 4.8 % | 5.7 % | ||
| E-Commerce Sales Q/Q Change | 2/19/2020 | Q4:2019 | 5.0 % | 4.6 % | 2.6 % | |
| Jobless New Claims | 2/20/2020 | WK 2/15, 2020 | 205 K | 206 K | 211 K | 210 K |
| Philadelphia FED Business Outlook | 2/20/2020 | February 2020 | 17 | 12 | 36.7 | |
| Leading Indicators | 2/20/2020 | January 2020 | -0.3 % | 0.3 % | 0.8 | |
| FED Balance Sheet | 2/20/2020 | WK 2/19, 2019 | $4.183 T | $4.172 T | ||
| Money Supply M2 Weekly Change | 2/20/2020 | WK 2/10, 2019 | -$4.9 B | $18.9 B | ||
| PMI Mfg. Flash | 2/21/2029 | February 2020 | 53.1 | 52.5 | 49.6 | |
| Existing Home Sales | 2/21/2020 | January 2020 | 5.540 M | 5.530 M | 5.450 M | 5.460 M |
| Baker-Hughes Rig Count | 2/21/2020 | WK 2/21, 2020 | 1045 | 1035 |
This week’s major events:
| Monday | Chicago FED National activity index; Dallas FED Mfg. Survey | |
| Tuesday | Redbook; CoreLogic Case Shiller HPI; FHFA Housing price index; | |
| Wednesday | MBA Mortgage Applications; New home sales; State street investor confidence index; Survey of Business uncertainty | |
| Thursday | Durable goods orders; GDP; Jobless Claims; Pending home sales index; Kansas City FED Mfg. index; Balance Sheet; Money Supply | |
| Friday | International trade in goods; Personal Income Outlays; Retail inventories; Wholesale inventories; Chicago PMI; Consumer sentiment; Baker-Hughes Rig count |
Economy:
Economy reports are positive. Empire State Manufacturing index is up. Retail sales are up. Business optimism index is up. Leading indicators are up.
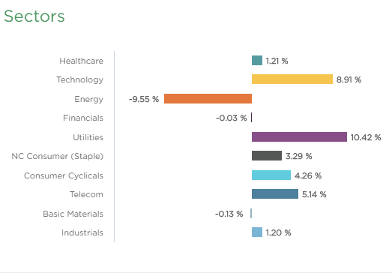
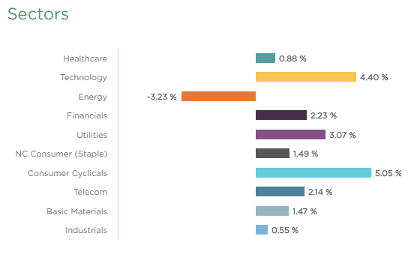
Sector performance
Stock to Watch: None for now.
Many stocks are extended from ideal buy points.
Strongest groups are Auto Manufacturers, Energy-solar, Semiconductor-equipment, Medical-Biomed/Biotech, Leisure-Gaming, Semiconductor-Fabless.
Weakest groups are Energy-Coal, Food-Beverages, Leisure Toys-games, Retail wholesale Auto Parts
Watch List: Our strong RS/Growth screen is showing following candidates.
PCTY, RNG, EPAM, FIVN, LULU, NOC, IPHI, COST, KEYS, VRTX, PODD, CMG, FTNT, FISV, GOOGL, MSFT, NTES, INCY, BABA, DOCU, ARES, FB, STNE, NOW, SE, PAYC, SHOP, UFPI, IBP, TNDM, PLMR, SEDG, SPLK, SQ, NVDA
Summary: Long awaited pull back in the market begins this week. Remove laggards from the portfolio and look for strong leaders to add in this pull back. This should be short lived pull back. Intermediate trend continues to be up.