
After overcoming resistance on both major indices’ week earlier, market followed up nicely this week with new highs. Trade Deal seems to be making progress from statements from China and White House. Economic news was good.
Earnings reports are coming favorably helping stocks to move up from sound bases built over last two months. We expect market to move up ahead as we leave seasonally weak period behind.
Recap of last week:
Economic Reports:
| Economy Indicator | Released Date | Period | Prior | Prior Revised | Consensus | Actual |
| Motor Vehicle Sales | 11/4/2019 | October 2019 | 17.2 M | 17.1 M | 17.0 M | 16.5 M |
| Factory Orders M/M Change | 11/4/2019 | Sept 2019 | -0.1 % | -0.5 % | -0.6 % | |
| International Trade Balance | 11/5/2019 | Sept 2019 | $-54.9 B | $-55.0 B | $-52.5 B | $-52.5 B |
| Store Sales Y/Y Change | 11/5/2019 | WK 11/2, 2019 | 4.5 % | 5.5 % | ||
| PMI Services Index | 11/5/2019 | Sept 2019 | 50.9 | 51.0 | 50.6 | |
| ISM Non-Mfg. Index | 11/5/2019 | Sept 2019 | 52.6 | 53.5 | 54.7 | |
| JOLTS Jobs Openings | 11/5/2019 | Sept 2019 | 7.051 M | 7.301 M | 7.024 M | |
| MBA Mortgage Applications W/W Change | 11/6/2019 | WK 11/1, 2019 | 0.6% | -0.1% | ||
| Non-farm Productivity Q/Q change | 11/6/2019 | Q3(p):2019 | 2.3% | 2.5% | 1.0% | -0.1% |
| Unit Labor Costs Q/Q Change | 11/6/2019 | Q3(p):2019 | 2.6% | 2.4% | 2.2% | 3.6% |
| Jobless New Claims | 11/7/2019 | WK 11/2, 2019 | 218 K | 219 K | 215 K | 211 K |
| Consumer Credit M/M Change | 11/7/2019 | Sept 2019 | $17.9 B | $17.8 B | $15 B | $9.5 B |
| FED Balance Sheet | 11/7/2019 | WK 11/6, 2019 | $4.020 T | $4.039 T | ||
| Money Supply M2 Weekly Change | 11/7/2019 | WK 10/28, 2019 | $43.1 B | $44.6 B | $39.6 B | |
| Consumer Sentiment | 11/8/2019 | Nov(p) 2019 | 95.5 | 96 | 95.7 | |
| Wholesale Inventories M/M % change | 11/8/2019 | Sept 2019 | 0.2% | 0.1 % | -0.3 % | -0.4 % |
| Baker-Hughes Rig Count | 11/8/2019 | WK 11/8, 2019 | 964 | 957 |
This week’s major events:
| Monday | |||
| Tuesday | Redbook; Small Business Optimism Index | ||
| Wednesday | MBA Mortgage Applications; CPI; FED Business Inflation Expectation; Treasury Budget; FED Chair Speaks | ||
| Thursday | Jobless Claims; PPI-FD; FED Balance Sheet; Money Supply | ||
| Friday | Retail Sales; Empire State Mfg. Survey; Import Export Prices; Industrial Production; Business Inventories; Baker-Hughes Rig count |
Economy:
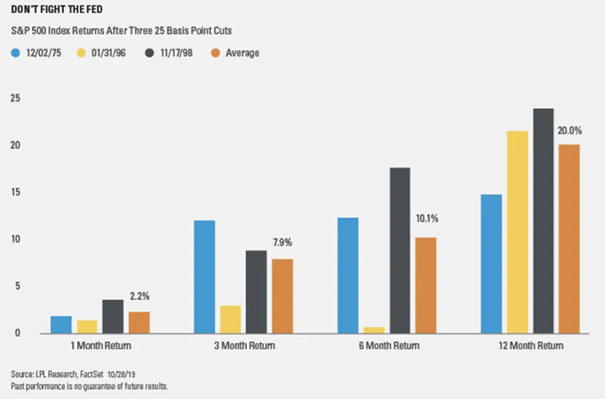
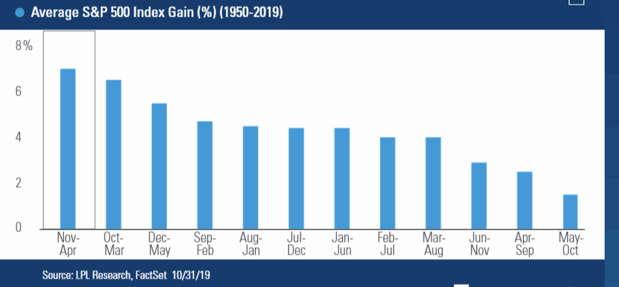
Economic news was positive. Job reports and consumer sector is doing fine. None of the economic gauges are signaling sign of recession. With the last three rate cuts by FED, mid-cycle correction is behind us. Historically, any year the markets are up by 20% until October in combination with three FED rate cuts have provided on average 20% gain over next year. We are also entering the most positive historical period, Nov-April, producing average return in S&P 500 of 6.8%.
Sector performance:
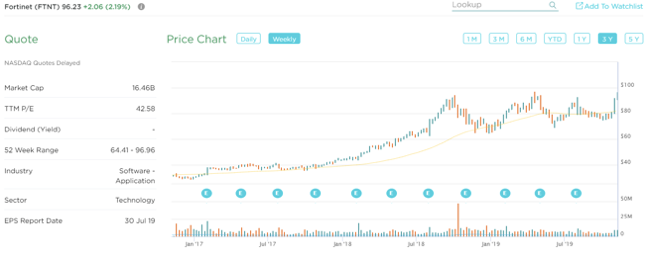
Stock to Watch: Fortinet Inc (FTNT)
Fortinet develops unified threat management systems to provide security and networking functions.
Fortinet has good track record in the industry with annual growth over 40 percentages. ROE of 40% and sales growth of 22%; 18%; 18% and 21% in past four quarters. Earnings growth is 84%; 39%; 41% and 37% for the same period. Gross margins are in mid- seventies consistently. Net margins have increased in high teens from low single digit. Institutional participation has increased steadily from 1333 to 1557.
Technically, it is coming out of a long consolidation of fourteen months. We expect price appreciation to continue near term and over next year.

Strongest groups are Semiconductor-equipment, Retail-home furnishings, Chemical paints, Commercial services-document management, Telecom-services
Weakest groups are Oil and Gas, Retail-Mall, Tobacco, Telecom-infrastructure, Food
Watch List: Our strong RS/Growth screen is showing following candidates.
PCTY, TEAM, RNG, EPAM, FIVN, LULU, SEDG, NOC, IPHI, COST, CPRT, ESNT, KEYS, VRTX, RDN, PODD, CMG, PAGS, FTNT
Summary:
Markets are following thru last week’s breakout. Economic indicators are showing no sign of recession in horizon. We are also entering historically most positive period for market. Currently we still see evidence of substantial under-allocation to stocks from many professionals and from the investing public at large of the kind that often presages a sustainable rally in the making. This doesn’t mean we enter market blindly. Prudent increase in participation is recommended.