
Monday’s lows created enough oversold condition for markets to rally, although on lower volume. Mexico is ready to put 600,000 troops at the southern border to pacify President Trump’s demand. Mr. President was also under pressure from other Republicans and business group. Talks with China have begun again. Jobs report on Friday was not good, markets hoping FED policymakers to lower the rates.
Markets are still news-driven, and we need to be careful. Last week news got better. Fortunately, leaders are acting well, and some are charging ahead making new highs. NASDAQ need to overcome resistance level of 7950 on greater volume in coming days for us to believe in this rally.
The market is in Uptrend.
Recap of last week:
Economic Reports
| Economy Indicator | Released Date | Period | Prior | Prior Revised | Consensus | Actual |
| PMI Mfg. Index | 6/3/2019 | May 2019 | 52.6 | 50.6 | 50.5 | |
| ISM Mfg. Index | 6/3/2019 | May 2019 | 52.8 | 53 | 52.1 | |
| Construction spending M/M Change | 6/3/2019 | April 2019 | -0.9% | 0.1% | 0.4% | 0.0% |
| Motor Vehicle Sales | 6/4/2019 | May 2019 | 16.4M | 16.3M | 16.9M | 17.3M |
| Redbook Store Sales Y/Y Change | 6/4/2019 | WK 6/1, 2019 | 5.7% | 5.8% | ||
| Factory Orders M/M Change | 6/4/2019 | April 2019 | 1.9% | 1.3% | -0.8% | -0.8% |
| MBA Mortgage Applications W/W Change | 6/5/2019 | WK 5/31, 2019 | -3.3% | 1.5% | ||
| ADP Employment Report | 6/5/2019 | May 2019 | 275,000 | 271,000 | 175,000 | 27,000 |
| PMI Services Index | 6/5/2019 | May 2019 | 53 | 50.9 | 50.9 | |
| ISM Mfg. Index | 6/5/2019 | May 2019 | 55.5 | 55.8 | 56.9 | |
| Challenger Job cut Report | 6/6/2019 | May 2019 | 40,023 | 58,577 | ||
| Trade Balance | 6/6/2019 | April 2019 | $-50.0B | $-51.9B | $-50.8B | $-50.8B |
| Jobless New Claims | 6/6/2019 | WK 6/1, 2019 | 215K | 218K | 215K | 218K |
| Non-farm Productivity Q/Q change | 6/6/2019 | Q1:2019 | 3.6% | ‘3.4% | 3.4% | |
| Unit Labor Costs Q/Q Change | 6/6/2019 | Q1:2019 | -0.9% | -0.8% | -1.6% | |
| FED Balance Sheet | 6/6/2019 | WK 6/5, 2019 | $3.851T | $3.848T | ||
| Money Supply Weekly Change | 6/6/2019 | WK5/27, 2019 | $45.5B | $56.6B | ||
| Non-farm Payrolls M/M change | 6/7/2019 | May 2019 | 263,000 | 224,000 | 180,000 | 75,000 |
| Unemployment Rate | 6/7/2019 | May 2019 | 3.6% | 3.7% | 3.6% | |
| Private Payrolls M/M Change | 6/7/2019 | May 2019 | 236,000 | 205,000 | 175,000 | 90,000 |
| Wholesale Inventories M/M % change | 6/7/2019 | April 2019 | -0.1% | 0.0% | 0.3% | 0.8% |
| Baker-Hughes Rig Count | 6/7/2019 | WK 6/7, 2019 | 1069 | 1078 |
This week’s major events:
| Monday | JOLTS | ||
| Tuesday | Small Business Optimism, PPI-FD, Redbook | ||
| Wednesday | MBA Mortgage Applications; CPI; Atlanta FED Survey; Treasury Budget | ||
| Thursday | Jobless Claims; Import Export Prices Index; FED Balance Sheet; Money Supply | ||
| Friday | Retail Sales; Industrial Production; Business Inventories; Consumer Sentiment; Baker-Hughes Rig Count |
Economy:
Private payrolls came in at 90,000 vs expectation of 175,000. Non-farm payrolls came in at 75,000 vs consensus estimate of 180,000. Wholesale inventories were much higher at 0.8% than consensus of 0.3%. Let us see if FED lowers the rates soon.
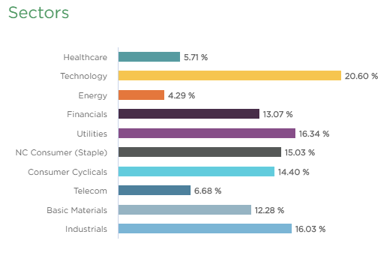
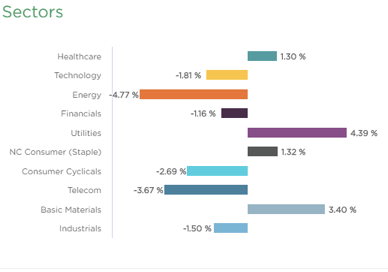
Sector performance YTD performance ending May 31, 2019:
Stock to Watch:
Let us watch for high RS stocks for now but hold on buying into new positions until signs of institutional demand returning into market.
Strongest groups are Software, Insurance, Business service, Insurance, Computer-Tech services, Computer Software-enterprise, Computer Software-Database, Telecom, Computer Software-Security.
Weakest groups are Retail; Food, Energy, Media; Medical
Watch List: Our strong RS/Growth screen is showing following candidates.
TEAM, CHGG, PYPL, CYBR, FIVN, CASY, LLY, LULU, NOW, HUBS, FIVE, ADBE, ADSK, MSFT, HEIA, TWLO, WDAY, ETSY, EPAM, MTCH, LPLA, GDDY; AMZN, PAGS, FB, FNKO, BAH, CPRT, ENTH, HEI, LLL, PAYC, PGR, PODD, VEEV, VRSN, KL
Summary:
As expected, short-term bounce is taking place from oversold condition. Look out for strong RS stocks in this correction for future leadership to emerge.