
All three major indexes retreated a bit but holding above support levels. Mixed economic data putting a question mark for how many rate cuts are ahead. Many companies report earnings this week. Most of the accelerated earnings gains due to Trump tax cut is behind us.
Geopolitical tensions with Iran is on the forefront with recent incidences. UK will be having a new Prime Minister which will have effects on the European Union and BREXIT.
Leaders are acting well, and some leaders are making new highs and others are breaking out of new bases.
The market is in Uptrend.
Recap of last week:
Economic Reports:
| Economy Indicator | Released Date | Period | Prior | Prior Revised | Consensus | Actual |
| Empire State Mfg.- Business Conditions | 7/15/2019 | July 2019 | -8.6 | 0.8 | 4.3 | |
| Retail Sales M/M change | 7/16/2019 | June 2019 | 0.5% | 0.4% | 0.1% | 0.4% |
| Retail Sales less autos M/M change | 7/16/2019 | June 2019 | 0.5% | 0.4% | 0.2% | 0.4% |
| Import Prices M/M Change | 7/16/2019 | June 2019 | -0.3% | 0.0% | -0.6% | -0.9% |
| Export Prices M/M Change | 7/16/2019 | June 2019 | -0.2% | -0.2% | -0.7% | |
| Import Prices Y/Y Change | 7/16/2019 | June 2019 | -1.5% | -1.1% | -1.9% | -2.0% |
| Export Prices Y/Y Change | 7/16/2019 | June 2019 | -0.7% | -0.8% | -1.2% | -1.6% |
| Redbook Store Sales Y/Y Change | 7/16/2019 | WK 7/13, 2019 | 6.2% | 4.7% | ||
| Industrial Production M/M Change | 7/16/2019 | June 2019 | 0.4% | 0.1% | 0.0% | |
| Manufacturing M/M Change | 7/16/2019 | June 2019 | 0.2% | 0.2% | 0.4% | |
| Capacity Utilization Rate Level | 7/16/2019 | June 2019 | 78.1% | 78.2% | 77.9% | |
| Business Inventories M/M Change | 7/16/2019 | May 2019 | 0.5% | 0.4% | 0.3% | |
| Housing Market Index | 7/16/2019 | July 2019 | 64 | 65 | 65 | |
| Foreign Demand for LT US Securities | 7/16/2019 | May 2019 | $46.9B | $3.5B | ||
| MBA Mortgage Applications W/W Change | 7/17/2019 | WK 7/12, 2019 | -2.4% | -1.1% | ||
| Housing Starts | 7/17/2019 | June 2019 | 1.269M | 1.265M | 1.260M | 1.253M |
| Housing Permits | 7/17/2019 | June 2019 | 1.294M | 1.299M | 1.300M | 1.220M |
| Jobless New Claims | 7/18/2019 | WK 7/13, 2019 | 209K | 208K | 215K | 216K |
| Philadelphia FED Business Outlook | 7/18/2019 | July 2019 | 0.3 | 4.5 | 21.8 | |
| Leading Indicators | 7/18/2019 | June 2019 | 0.0% | 0.1% | -0.3% | |
| FED Balance Sheet | 7/18/2019 | WK 7/17, 2019 | $3.815T | $3.808T | ||
| Money Supply M2 Weekly Change | 7/18/2019 | WK 7/8, 2019 | $46.0B | $45.4B | $0.4B | |
| Consumer Sentiment | 7/19/2019 | July 2019 | 98.2 | 98.6 | 98.4 | |
| Baker-Hughes Rig Count | 7/19/2019 | WK 7/19, 2019 | 1075 | 1072 |
This week’s major events:
| Monday | Chicago Fed National Activity | ||
| Tuesday | Redbook; FHFA House Price Index; Existing Home Sales; Richmond Fed Manufacturing Index | ||
| Wednesday | MBA Mortgage Applications; PMI Composite Flash; New Home Sales | ||
| Thursday | Durable Goods Orders; International Trade in Goods; Jobless Claims; Retail Inventories; Kansas City Fed Manufacturing Index; Fed Balance Sheet; Money Supply | ||
| Friday | GDP; Baker-Hughes Rig Count |
Economy:
Economy news gave mixed signals this week.
Retail sales rose a better than expected 0.4% last month. Results point to healthy consumer spending and raise an inkling of doubt how many Fed rate cuts to expect this year. Wall Street expected a 0.1% rise in June. The year-over-year pace of sales accelerated to 3.4% overall.
The economy expanded at a modest pace with job gains slowing somewhat and inflation remaining stable or weaker, according to Fed Beige Book. The labor market continued to tighten, putting some upward pressure on compensation. The report is unlikely to sway the debate policymakers will have in the July meeting.
Focus on the data has been – is it weak enough to warrant a rate cut in July? Or is it showing renewed strength that will lead the Fed to hold off on any actions?
Stronger-than-expected: July Philly Fed Business outlook at +21.8, roared past the +5 consensus and resurged from +0.3 in June.
July Empire State Survey of 4.30 beat the +0.8 consensus and reversed from the decline of 8.60 in June.
This week’s Jobless Claims fell more than expected, by 42K to 1.686M vs. 1.700M expected and 1.728M prior.
June Core Retail Sales rose 0.4%, stronger than the 0.2% increase expected and matched the May pace; the headline increase of 0.4% compared with the +0.1% consensus.
In-line: July NABH Housing market Index of 65 matched consensus and increased from 64 in June.
Weaker-than expected: Initial Jobless Claims crept up — rising 8K to 216K, more than the 215K expected.
July Consumer sentiment at 98.4 fell short of the 98.6 estimates, though it did strengthen from 98.2 in June.
June Leading Index unexpected lost ground, falling 0.3% to 111.5 vs. consensus of +0.1% and vs. flat in May.
June Housing Starts, down 0.9% to 1.253M, disappointed vs. consensus of 1.260M; however, May’s figure was revised upward to 1.269M from 1.265M; building permits also fell short at 1.220M vs. 1.300M expected and 1.299M in May.
June Industrial Production came in flat at 109.6, weaker than the expectation of a 0.1% increase, and down from its 0.4% increase in May; capacity utilization at 77.9% trailed the consensus of 78.2% and fell from 78.1% in May.
June import prices fell 0.9% M/M, more than the -0.7% consensus and the 0.3% decline in May; export prices, down 0.7%, also came in significantly below the 0.2%% decline expected.
Last on the list is May Business Inventories up 0.3% to $2.036.4B, didn’t live up to the 0.4% increase expected and weakened from the 0.5% rise in April; inventory/sales ratio increased to 1.39 from 1.34 a year ago.
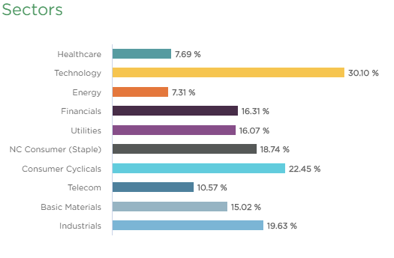
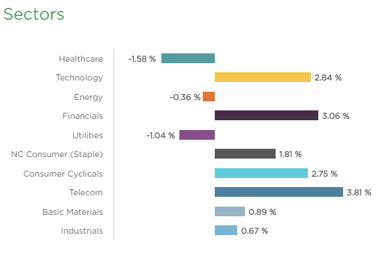
Sector performance:
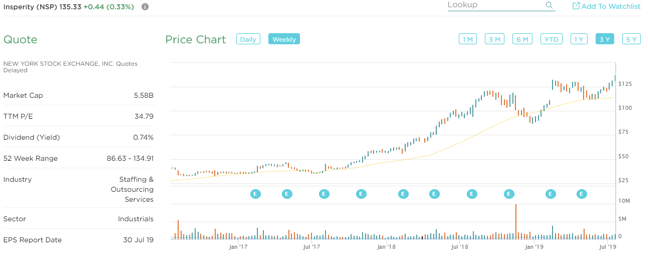
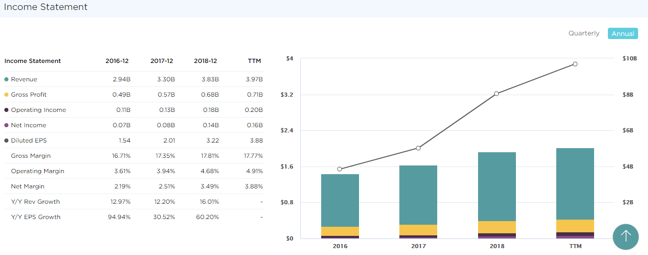
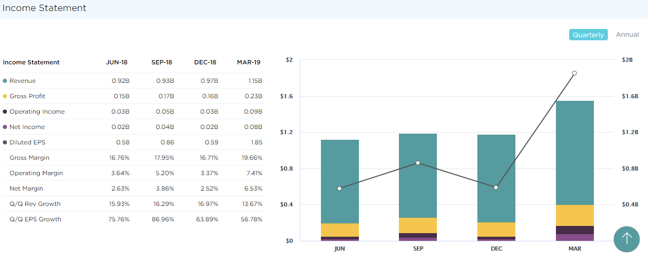
Stock to Watch: Insperity (NSP)
Insperity Inc. primarily provides a wide range of human resources and business solutions that help businesses improve their performance. Products are offered through the company’s Workforce Optimization and Workforce Synchronization solutions, which comprise various human resource functions, such as payroll and employment administration, government compliance, performance management, training and development services.
NSP has been growing over 47% annually. Last few quarters sales growth has been fantastic 16%; 16%; 17%; 14% with EPS growth of 56%; 67%; 25%; 40%. Annual EPS in 2016 of $1.54 has grown to $3.88 in TTM. The estimated EPS growth for the next two years is 17%. It has seen growth in equity steadily for the past four years. It has a ROE of 219%. Management owns 7% of shares outstanding. Institutional owners have increased from 611 to 631 in past four quarters showing institutional confidence. NSP has been the leader in the industry. It has been a leader also in the current cycle with strong relative strength gaining over 50% within six months. It is an ideal time to add/buy NSP as it tries to break out of shallow price consolidation of 16% over 21 weeks.
Strongest groups are Energy, Software, Insurance, Business service, Computer-Tech services, Computer Software-enterprise, Computer Software-Database, Telecom, Computer Software-Security.
Weakest groups are Retail, Food, Auto, Media, Medical
Watch List: Our strong RS/Growth screen is showing the following candidates.
TEAM, CHGG, PYPL, CYBR, FIVN, SHOP, LLY, LULU, NOW, HUBS, FIVE, ADBE, ADSK, MSFT, HEIA, TWLO, WDAY, ETSY, EPAM, MTCH, LPLA, GDDY; AMZN, PAGS, FB, FNKO, BAH, CPRT, ENTH, HEI, LLL, PAYC, PGR, PODD, VEEV, VRSN, KL, GNRC, CACC, AMD, BZUN, NSP
Summary:
Major indexes are holding support levels. Earnings season is upon us. Look out for strong RS stocks and add early leaders or new ones that are emerging here.