
This week all of last week’s gains were wiped out. Optimism generated by Chinese Premier and President Trump on resolving Trade and Tariff issues were being questioned with Huawei’s CFO Meng Wanzhau’s arrest on violating US sanctions against Iran. On Tuesday, indexes reversed from resistance levels at 50DMA & 200DMA. Friday’s poor jobless report should help FED to hold on future rate increase. Indexes are testing earlier lows near 7000 on NASDAQ & 2600 on S&P. Markets are oversold here and should hold these lows, but we could also get final shakeout. Volatility is above normal (range of 16 to 28 on $VIX) since October. It’s forming higher base and can be interpreted as deeper correction ahead. Volatility need to come down below 16 before signs emerge of correction over.
World markets are testing prior lows here.
Recap of last week:
US Tariffs: Huawei shows Donald Trump is winning China trade war. Besides the headline of court room drama of Huawei’s CFO in CANADA, pressure on Huawei has been building on recently. New Zealand & Australia has blocked Huawei’s, China’s national champion, participation in 5G networks. Japanese will ban purchases from Huawei & ZTE. European Union is raising alarm about Huawei security risks. UK based BT will bar Huawei from ‘core’ 5G networks and will remove from its ‘core’ 3G & 4G systems. China has kept moving forward with the commitment made between Trump and Xi on Saturday’s meeting in Argentina. Chinese minister of Commerce said Beijing will implement agreements on agriculture, energy and cars. Tariffs on auto may come down from 40% to 15%. Beijing has sent a signal that it won’t let pride come between China trade deal. It’s more likely that there will be China deal.
Economic Reports:
| Economy Indicator | Released Date | Period | Prior | Prior Revised | Consensus | Actual |
| PMI Mfg Index | 12/3/2018 | Nov-18 | 55.7 | 55.3 | 55.3 | |
| ISM Mfg Index | 12/3/2018 | Nov-18 | 57.7 | 57.2 | 59.3 | |
| Construction Spending M/M Change | 12/3/2018 | Oct-18 | 0 | -0.01% | 0.30% | -0.10% |
| Motor Vehicle Sales | 12/4/2018 | Nov-18 | 17.5M | 17.2M | 17.4M | |
| Jobless Claims (New) | 12/6/2018 | Wk 12-01 | 234K | 235K | 225K | 231K |
| ADP Employment Report | 12/6/2018 | Nov-18 | 227,000 | 225,000 | 175,000 | 179,000 |
| Factory Orders (M/M Change) | 12/6/2018 | Oct-18 | 0.7% | 0.2% | -2.0% | -2.1% |
| ISM Non-Mfg Index | 12/6/2018 | Nov-18 | 60 | 59 | 61 | |
| Non-farm Payrolls (M/M Change) | 12/7/2018 | Nov-18 | 250,000 | 237,000 | 190,000 | 155,000 |
| Unemployment Rate | 12/7/2018 | Nov-18 | 3.70% | 3.70% | 3.70% | |
| Consumer Sentiment | 12/7/2018 | December | 97.5 | 97.5 |
Non-farm payrolls added 155,000 versus 190,000 expected. Prior period numbers were revised down to 237,000. This could mean FED will not be in a hurry to raise rates.
This week’s major events:
| Monday | N/A |
| Tuesday | PPI FD |
| Wednesday | CPI |
| Thursday | Jobless Claims |
| Friday | Retail Sales; Industrial production; Business Inventories |
Sector performance in last 1 month ending December 07, 2018:
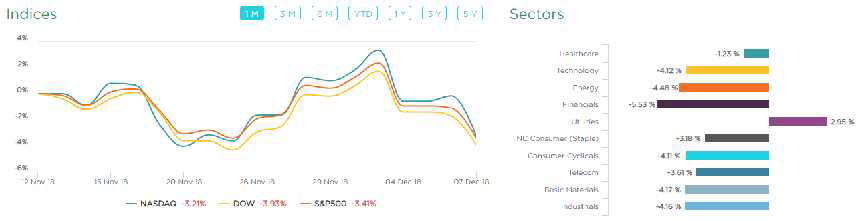
Chart 1. One Month performance of Sectors. Courtesy www.Vistalytics.COM
Chart 1 above shows that all sectors are down last month except Utilities while major indexes are testing lows here.
Strongest groups are Telecom, Auto Parts & Healthcare (Medical-Outpatient)
Weakest groups are Basic Materials, Energy & Steel.
Watch List: Our strong RS/Growth screen narrowed lists of potential candidates to put on “Watch list” Some of them are AMED, BEAT, PRAH, VEEV
Summary:
Volatile market environment needs to tip its hand one way or the other, if correction is over or extending into ‘Bear’ territory. Protect your capital for future opportunities. In Bear environment, no stocks are safe to own.