
Market is testing Q3 2018 highs after strongest performance since Q1 of 2009. Healthy market should take a pause here before attempting to make new highs. US economic news are positive. US- China seems to be close to reaching trade deal.
The market is in ‘Confirmed Up trend’. Our models are positive for intermediate & long trend. Stay focused on strong holdings and opportunity to add to them.
Earnings announcements for Q1 have started. JPMorgan (JPM) announced significantly better earnings than expected and the stock jumped nearly 5%. Disney (DIS) jumped an astounding 11% after announcing a new video streaming service. IPOs are in vogue with Lyft’s recent IPO and Uber’s IPO expected to be announced in the next few weeks. 2019 will likely be a record year for IPOs. In 2018, total IPO volume in the US was around $50b. If Uber goes public, we are going to be significantly above that number. New companies are driving most of the innovation and productivity growth in the economy and the pace of IPOs is a healthy counter balance to the massive stock buy backs that have been taken place recently.
Recap of last week:
Economic Reports:
| Economy Indicator | Released Date | Period | Prior | Prior Revised | Consensus | Actual |
| Factory Orders | 4/8/2019 | Feb 19 | 0.1% | 0.0% | -0.6% | -0.5% |
| Samll Businesss Optimism Index | 4/9/2019 | March 19 | 101.7 | 101.7 | 101.8 | |
| JOLTS Jobs Openings | 4/9/2019 | Feb 19 | 7.581M | 7.625M | 7.565M | 7.087M |
| Redbook Store Sales Y/Y Change | 4/9/2019 | WK 4/6, 2019 | 4.4% | 4.8% | ||
| MBA Mortgage Applications W/W Change | 4/10/2019 | WK 4/5, 2019 | 18.6% | -5.6% | ||
| CPI M/M Change | 4/10/2019 | March 19 | 0.2% | 0.3% | 0.4% | |
| Jobless New Claims | 4/11/2019 | WK 4/6, 2019 | 202K | 204K | 211K | 196K |
| PPI FD M/M Change | 4/11/2019 | March 19 | 0.1% | 0.4% | 0.6% | |
| Import Prices M/M Change | 4/12/2019 | March 19 | 0.6% | 1.0% | 0.4% | 0.6% |
| Export Prices M/M Change | 4/12/2019 | March 19 | 0.6% | 0.7% | 0.3% | 0.7% |
| Consumer Sentiment | 4/12/2019 | Apr 19 | 98.4 | 98 | 96.7 | |
| Baker-Hughes Rig Count | 4/12/2019 | Wk 4/12; 2019 | 1093 | 1088 |
This week’s major events:
| Monday | Empire State Mfg Survey |
| Tuesday | Redbook; Industrial Production; Housing Market Index |
| Wednesday | MBA Mortgage Applications; Wholesale Trade; International Trade |
| Thursday | Jobless Claims; Retail Sales; PMI Composite; Business Inventories; Leading Indicators |
| Friday | Housing Starts; Baker-Hughes Rig count |
Economy:
Jobs reports are positive. Store sales are increasing. Overall healthy economic reports.
Annual inflation in the US was 1.9% last month, which is slightly higher than consensus estimates of 1.8% but still low, given our decent economic growth. Oil has posted its sixth week of gains and has jumped nearly 50% since December.
Producer prices came in higher than expected with an annualized 2.2% increase vs 1.9% expected.
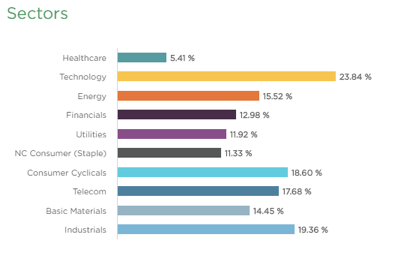
Sector performance YTD performance ending April 12, 2019:
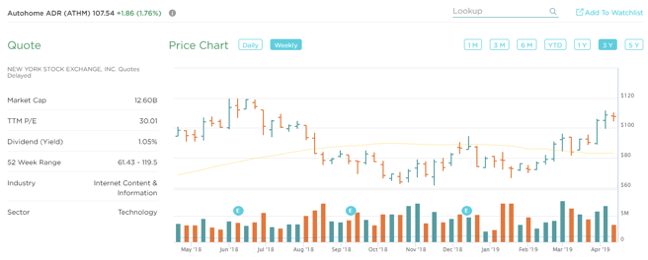
Stock to Watch: Autohome (ATHM)
Autohome is a Chinese company in Internet Content industry with solid historical performance. With trade war fear subsiding this stock has potential to outperform in weeks ahead.
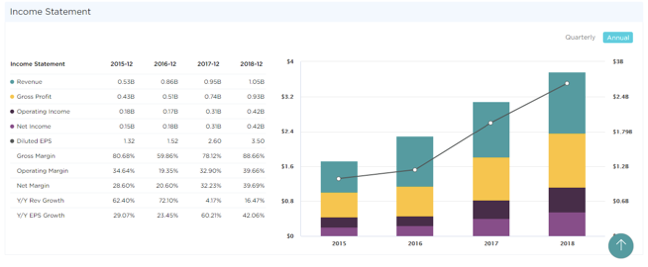
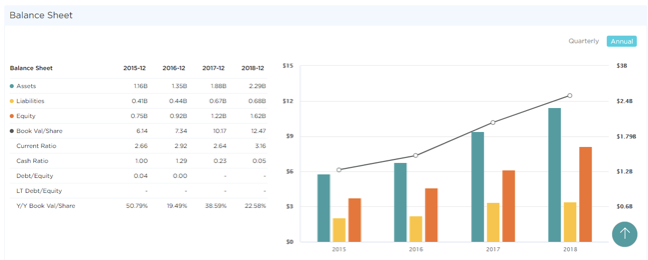
Autohome has been growing 35% annually. Last few quarters sales growth has been 22%; 18%; 18% with EPS growth of 32%; 50%; 32%. Annual EPS in 2015 of $1.32 has grown to $2.60 in 2017. Estimated EPS growth for next two years is 30%. It has seen growth in equity steadily for past four years. Net margins have grown from 20.6% to 40% and ROE of 32%. Management owns 19% of shares outstanding.
It is an ideal time to buy Autohome as it forms a handle of a classic price consolidation of 10 months.
Strongest groups are Software, Finance, Medical, Energy, Insurance, Computer-Tech services, Chips, Computer Software-enterprise, Computer Software-Database, Telecom, Computer Software-Security.
Weakest groups are Transport; Retail; Food.
Watch List: Our strong RS/Growth screen is showing following candidates. List is expanding this week.
TEAM, CHGG, FN, PYPL, CYBR, BEAT, VRTX, FIVN, CASY, LLY, LULU, NOW, SAVE, HUBS, BA, FIVE, ADBE, INCY, ABMD, PANW, SSNC, ADSK, MSFT, HEIA, UBNT, TWLO, TTD, WDAY, ETSY, EPAM, ANET, MTCH, LPLA, FTNT, GDDY; AMZN, PAGS, ATHM
Summary: Markets are challenging to last year highs. It has an amazing comeback. We should expect some sideways action before making new highs. Let us watch stocks that hold well from leading industries.