
Friday’s strong Job report pushes all three major indices close to high. Late last week and early this week complacency put the market on skids. Job report on Friday was strong adding 266,000 new jobs and putting unemployment at historically low of 3.5%
Markets bounced off 21DMA nicely. Leaders acted well in this short-term correction.
We expect that equities will continue to trend higher through a seasonally strong end-of-year period.
Recap of last week:
Economic Reports:
| Economy Indicator | Released Date | Period | Prior | Prior Revised | Consensus | Actual |
| PMI Mfg. Index | 12/2/2019 | November 2019 | 51.3 | 52.2 | 52.6 | |
| ISM Mfg. Index | 12/2/2019 | November 2019 | 48.3 | 49.4 | 48.1 | |
| Construction spending M/M Change | 12/2/2019 | October 2019 | 0.5 % | -0.3% | 0.4% | 0.8% |
| Store Sales Y/Y Change | 12/3/2019 | WK 11/30, 2019 | 4.4 % | 7.9 % | ||
| Motor vehicle sales | 12/4/2019 | November 2019 | 16.5 M | 17 M | 17.1 M | |
| MBA Mortgage Applications W/W Change | 12/4/2019 | WK 11/29, 2019 | 1.5 % | -9.2 % | ||
| ADP Employment Report | 12/4/2019 | November 2019 | 125,000 | 140,000 | 156,000 | 67,000 |
| PMI Services Index | 12/4/2019 | October 2019 | 50.6 | 51.6 | 51.6 | |
| ISM Non-Mfg. Index | 12/4/2019 | October 2019 | 54.7 | 54.5 | 53.9 | |
| Challenger Job cut Report | 12/5/2019 | November 2019 | 50,275 | 44,469 | ||
| International Trade Balance | 12/5/2019 | October 2019 | $-52.5 B | $-51.1 B | $-48.6 B | $-47.2 B |
| Jobless New Claims | 12/5/2019 | WK 11/30, 2019 | 213 K | 218 K | 203 K | |
| Factory Orders M/M Change | 12/5/2019 | October 2019 | -0.6 % | -0.8 % | 0.3 % | 0.3 % |
| FED Balance Sheet | 12/5/2019 | WK 12/4, 2019 | $4.053 T | $4.066 T | ||
| Money Supply M2 Weekly Change | 12/5/2019 | WK 11/25, 2019 | $30.8 B | $38.5 B | ||
| Non-farm Payrolls M/M change | 12/6/2019 | November 2019 | 128,000 | 156,000 | 180,000 | 266,000 |
| Unemployment Rate | 12/6/2019 | November 2019 | 3.6 % | 3.6 % | 3.5 % | |
| Private Payrolls M/M Change | 12/6/2019 | November 2019 | 131,000 | 163,000 | 168,000 | 254,000 |
| Average Hourly Earnings M/M change | 12/6/2019 | November 2019 | 0.2 % | 0.4 % | 0.3 % | 0.2 % |
| Average Workweek | 12/6/2019 | November 2019 | 34.4 hrs. | 34.4 hrs. | 34.4 hrs. | |
| Manufacturing Payrolls M/M Change | 12/6/2019 | November 2019 | -36,000 | -43,000 | 15,000 | 54,000 |
| Consumer Sentiment | 12/6/2019 | Dec(p) 2019 | 96.8 | 96.9 | 99.2 | |
| Consumer Credit M/M Change | 12/6/2019 | October 2019 | $9.5 B | $9.6 B | $15.8 B | $18.9 B |
| Wholesale Inventories M/M % change | 12/6/2019 | October 2019 | -0.4% | -0.7 % | 0.1 % | |
| Baker-Hughes Rig Count | 12/6/2019 | Wk 12/6, 2019 | 928 | 937 |
This week’s major events:
| Monday | Ameritrade IMX index | |
| Tuesday | FOMC meeting; NFIB small business Optimism Index; Productivity and costs; Redbook | |
| Wednesday | MBA Mortgage Applications; CPI; Atlanta FED Business Inflation Expectation; Quarterly services survey; FOMC Meeting Announcement; Treasury Budget | |
| Thursday | Jobless Claims; PPI-FD; FED Balance Sheet; Money Supply | |
| Friday | Retail Sales; Import and Export Prices; Business Inventories; Baker-Hughes Rig count |
Economy:
Economic news was positive. Job report was way over expectations (180,000), adding 266,000 jobs in November. Private-sector payrolls grew by 254,000. Fed is committed to raising inflation and holding rates steady is good news for markets. Average hourly growth came in 3.1 %, also better than expected. Jobless rate dipped to 50-year low 3.5 %.
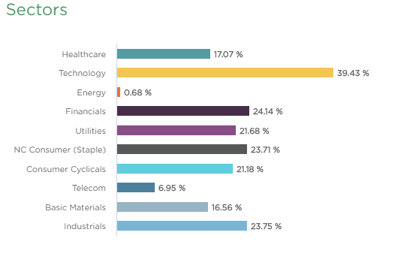
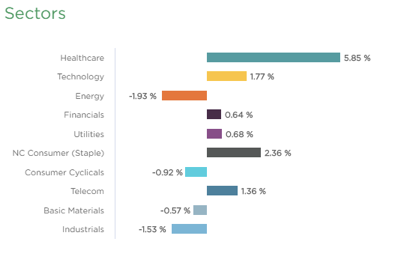
Sector performance
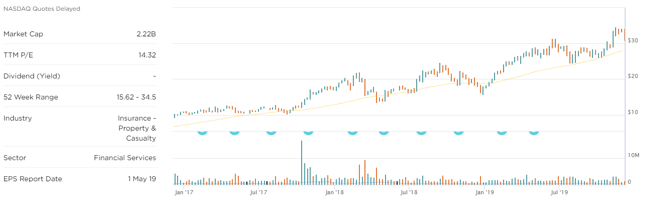
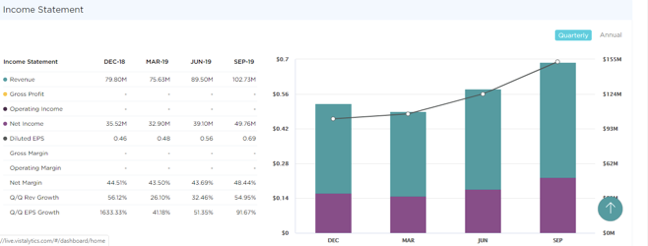
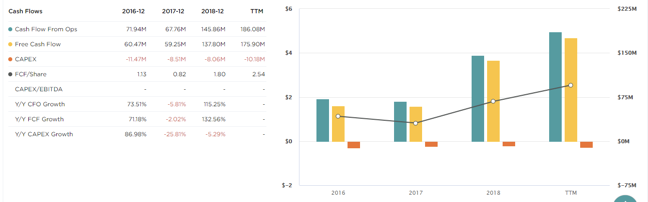
Stock to Watch: NMI Holdings Inc. (NMIH)
NMI Holdings Inc through its subsidiaries provides private mortgage guaranty insurance. The company offers mortgage insurance, reinsurance on loans and outsourced loan review services to mortgage loan originators. It serves national and regional mortgage banks, money center banks, credit unions, community banks, builder-owned mortgage lenders, Internet-sourced lenders, and other non-bank lenders.
NMI Holdings has annual growth over 181 percentages. ROE of 19% and sales growth of 56%; 26%; 32% and 54% in past four quarters. Net margins are in mid-forties consistently. FCF/Share has doubled from $1.13 to $2.54 over last four years. Institutional participation has increased steadily from 385 to 445.
We expect price appreciation to continue near term and over next year.
Strongest groups are Elect-Contract Manufacturing, Building construction Products, Semiconductor-equipment, Retail-home furnishings, Medical-Biomed/Biotech, Semiconductor Manufacturing.
Weakest groups are Oil and Gas, Retail-Mall, Food-Beverages, Leisure Toys-games, Tobacco, Telecom-infrastructure
Watch List: Our strong RS/Growth screen is showing following candidates.
PCTY, RNG, EPAM, FIVN, LULU, NOC, IPHI, COST, CPRT, ESNT, KEYS, VRTX, RDN, PODD, CMG, FTNT, FISV, GOOGL, MSFT, NMIH, NTES, INCY, BABA, DOCU, ARES, FB, STNE, NOW, SE, PAYC, SHOP, CROX, AUDC, UFPI, JBL, MHO, IBP
Summary:
Santa Claus rally continues. President Trump’s trade decision on December 15, 2019 will put market on hold this week. Equities may continue to trend higher through a seasonally strong end-of-year period.