
Dow Jones is trading above 200DMA resistance. Nasdaq is heading towards 200DMA around 7500 level. So is true for S&P index heading towards 2750-2800 area. Many leaders are participating last couple weeks. Be watchful for nature of consolidation this week or two. The market is in confirmed rally. Volatility index VIX is breaking support at 16 today. This is encouraging for bulls.
US China talks are going OK. FED is softening. China is injecting record amounts of liquidity into the system. ECB and Bank of Japan are loosening as well. All this should lead to improved global economy in coming months.
Recap of last week:
FED Softened: The Fed announced, as expected, no change in interest rates. Chairman Powell also softened his outlook regarding further interest rate hikes, leading to a jump in bond prices. Powell said without a marked increase in inflation, he is going to go easy on future rate hikes. Indeed, average hourly earnings last month have only increased by 0.1%. FED also stated that QT may taper down depending on incoming data and will never go back to its pre-crisis levels. That was music to Bulls last week. No matter if you are a Trump supporter or not, purely on economic terms, the Trump presidency appears to be good for the economy, even though it is impossible to determine exactly cause and effect.
Economic Reports:
| Economy Indicator | Released Date | Period | Prior | Prior Revised | Consensus | Actual |
| Chicago Fed National Activity | 1/28/2019 | Dec-18 | 0.22 | 0.21 | 0.15 | 0.27 |
| Dallas Fed Mfg Survey | 1/28/2019 | Jan-19 | 7.3 | 14.5 | ||
| S&P Corelogic Case-Shiller HPI | 1/29/2019 | Nov-18 | 0.4% | 0.4% | 0.3% | |
| Consumer Confidence | 1/29/2019 | Jan-19 | 128.1 | 126.6 | 124.3 | 120 |
| MBA Mortgage Applications W/W change | 1/30/2019 | WK 1/25 | -2.7% | -3.0% | ||
| ADP Employment Report | 1/30/2019 | Jan-19 | 271,000 | 263,000 | 174,000 | 213,000 |
| GDP Q/Q Change | 1/30/2019 | Q4-2018 | 3.4% | 2.6% | ||
| Retail Sales M/M | 1/31/2019 | Dec-18 | 1.4% | 1.6% | -0.5% | -4.3% |
| Challenger Job Cuts | 1/31/2019 | Jan-19 | 43,844 | 52,988 | ||
| PMI Mfg Index | 1/31/2019 | Jan-19 | 53.8 | 54.9 |
Housing market data is continuing down trend. Wage growth is the most important data to watch in coming months to gauge inflation in the economy.
This week’s major events:
| Monday | Motor Vehicle Sales; Factory Orders |
| Tuesday | Redbook; PMI Services Index; ISM Non-Mfg Index |
| Wednesday | MBA Mortgage Applications; Productivity and costs |
| Thursday | Jobless Claims; Consumer Credit |
| Friday | Wholesale Trade |
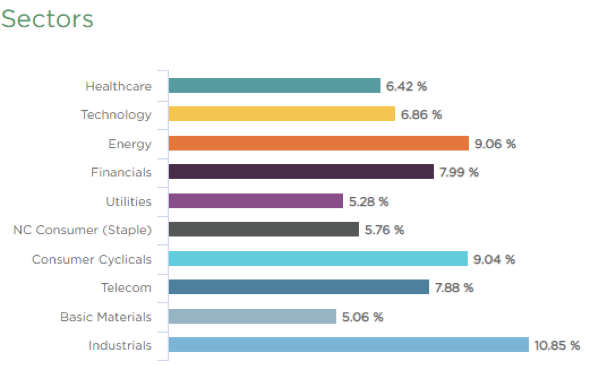
Sector performance YTD ending Feb 1, 2019:
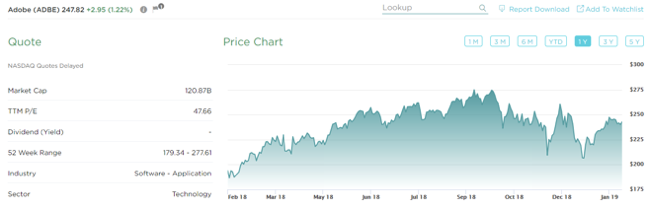
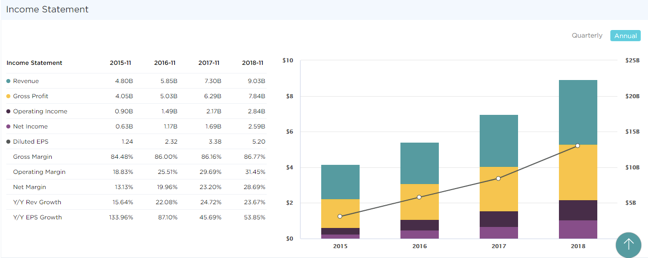
Stock to Watch: ADOBE Software
This week we highlight Adobe Software. Israeli based security company has a solid annual growth rate of 43%. Its Gross Margins are 85%. Net Margins have expanded steadily from 13% to 28%. In past four quarters, EPS has been steady (65%, 63%, 57%, 45%) with Sales growth (24%; 24%; 24%; 23%). Next Qtr EPS est is 44%. Institutional ownership has steadily gone up in last four quarters from 2474 to 2877. Fidelity Contrafund; MFS growth; Janus Henderson are few top mutual funds that have committed greater than 2% of assets to this stock.
In recent market correction, stock had held up well with only 26% correction. Stock is setting up to from double-bottom buy above $260.85
Strongest groups are Computer-Tech services, Computer Software-enterprise, Computer Software-Database, Telecom, Computer Software-Security.
Weakest groups are Oil& Gas Exploration & production, Transportation & Steel.
Watch List: Our strong RS/Growth screen is showing following candidates.
TEAM, CHGG, FN, PYPL, QNST, CYBR, BEAT, VRTX, FIVN, CASY, LLY, LULU, NOW, SAVE, HUBS, BA, FIVE, ADBE
Summary:
Markets are heading higher. More leaders are participating in the rally. It’s ok to add exposure to strong groups.