Markets looking better this week and very close to testing highs. 50 DMA should act as support if this rally has to hold.
This week is critical because of FED meeting and announcements on Tuesday and Wednesday. On Monday Empire State manufacturing will be released. Industrial production and Redbook retail results on Tuesday. Wednesday Philadelphia Fed survey is released.
Oil fields were attacked over the weekend causing concern for stability of energy resource.
This market is still news driven and it has the potential to disappoint us.
Recap of last week:
Economic Reports:
| Economy Indicator | Released Date | Period | Prior | Prior Revised | Consensus | Actual |
| Ameritrade Investor Movement Index | 9/9/2019 | August 2019 | 4.60 | 4.62 | ||
| Consumer Credit M/M change | 9/9/2019 | July 2019 | $14.6 B | $13.8 B | $16.1 B | $23.3 B |
| NFIB Small Business Optimism Index | 9/10/2019 | August 2019 | 104.7 | 103.5 | 103.1 | |
| Redbook Store Sales Y/Y Change | 9/10/2019 | WK 9/7, 2019 | 6.5% | 6.4% | ||
| JOLTS Jobs Openings | 9/10/2019 | July 2019 | 7.348M | 7.248M | 7.311M | 7.217M |
| MBA Mortgage Applications W/W Change | 9/11/2019 | WK 9/6, 2019 | -3.1% | 2.0% | ||
| PPI FD M/M Change | 9/11/2019 | August 2019 | 0.2% | 0.1% | 0.1% | |
| PPI FD Y/Y Change | 9/11/2019 | August 2109 | 1.7% | 1.8% | 1.8% | |
| Atlanta Fed Business Infl. Expectations % Yr/Yr | 9/11/2019 | September 2019 | 2.0% | 2.0% | ||
| Wholesale Inventories M/M % change | 9/11/2019 | July 2019 | 0.0% | -0.1% | 0.2% | |
| CPI M/M Change | 9/12/2019 | August 2019 | 0.3% | 0.1% | 0.1% | |
| CPI Y/Y Change | 9/12/2019 | August 2019 | 1.8% | 1.7% | 1.7% | |
| Jobless New Claims | 9/12/2019 | WK 9/7, 2019 | 217 K | 219 K | 215 K | 204 K |
| Treasury Budget level | 9/12/2019 | August 2019 | $-119.7 B | $-117.8 B | $-200.3 B | |
| FED Balance Sheet | 9/12/2019 | WK 9/11, 2019 | $3.762 T | $3.770 T | ||
| Money Supply M2 Weekly Change | 9/12/2019 | WK 9/2, 2019 | $20.6 B | $20.7 B | $40.6 B | |
| Retail Sales M/M change | 9/13/2019 | August 2019 | 0.7% | 0.8% | 0.2% | 0.4% |
| Retail Sales less autos M/M change | 9/13/2019 | August 2019 | 1.0% | 0.2% | 0.0% | |
| Import Prices M/M Change | 9/13/2019 | August 2019 | 0.2% | 0.1% | -0.5% | -0.5% |
| Export Prices M/M Change | 9/13/2019 | August 2019 | 0.2% | -0.1% | -0.6% | |
| Import Prices Y/Y Change | 9/13/2019 | August 2019 | -1.8% | -1.9% | -1.8% | -2.0% |
| Export Prices Y/Y Change | 9/13/2019 | August 2019 | -0.9% | -1.4% | ||
| Business Inventories M/M Change | 9/13/2019 | July 2019 | 0.0% | 0.3% | 0.4% | |
| Consumer Sentiment | 9/13/2019 | Sept.(p) 2019 | 89.8 | 91.0 | 92.0 | |
| Baker-Hughes Rig Count | 9/13/2019 | WK 9/13, 2019 | 1045 | 1020 |
This week’s major events:
| Monday | Empire State Mfg. Survey | ||
| Tuesday | FOMC Meeting; Redbook; Industrial Production; Housing Market Index; Treasury International Capital | ||
| Wednesday | MBA Mortgage Applications; Housing Starts; FOMC Meeting Announcements & Fed Chair’s Press Conference | ||
| Thursday | Jobless Claims; Philadelphia Fed Business Outlook; Current Account; Existing Home Sales; FED Balance Sheet; Money Supply | ||
| Friday | Baker-Hughes Rig count |
Economy:
Jobless claims were lower. Inventories were up. Retail sales were down. FED meeting and interest rate decision this week is critical in light of strong dollar and EC and China are pursuing easy money policy.
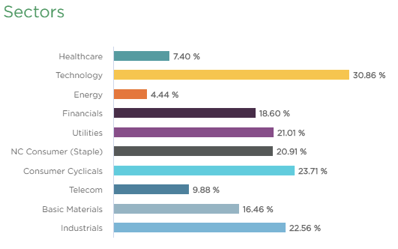
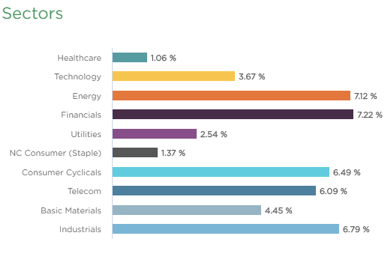
Sector performance:
Stock to Watch: None
Strongest groups are Energy-Solar, Mining-Gold/Silver, Retail Automobile, Telecom, Computer Software-enterprise, Consumer Services-Education, Insurance, Aerospace/Defense.
Weakest groups are Oil and Gas, Retail-Mall, Tobacco, Steel Producers, Food
Watch List: Our strong RS/Growth screen is showing following candidates.
CMG, TTD, OLED, PAGS, PAYC, PCTY, TEAM, VEEV, HEI, RNG, EPAM, SHOP, FIVN, LULU, V, MA, EDU, COST, FICO
Summary:
Major indexes overcame resistance at 50DMA. Volatility has come down to normal and leadership is acting well indicating positive environment near term barring news impact. It’s ok to participate in the market with caution.