
Trade optimism and Earnings results continue to lift stocks up. S&P trading at new high north of 3300 level with several sectors participating. Small caps are leading the market with Russel 2000 index getting close to high.
China’s GDP grew 6% year over year in the fourth quarter 2019. We are seeing stabilization in global economic data after difficult 2019.
Many investors are considering the upcoming presidential election as an impending storm for the stock market. There is a lot of uncertainty surrounding the November vote. History shows stocks have thrived in years when a sitting president is up for re-election.
Sentiment is getting overdone short-term and we expect volatility to rise but intermediate term indicators are positive.
Recap of last week:
Economic Reports:
| Economy Indicator | Released Date | Period | Prior | Prior Revised | Consensus | Actual |
| Treasury Budget level | 1/13/2020 | December 2019 | -$208.8 B | -$15 B | -$13.3 B | |
| NFIB Small Business Optimism Index | 1/14/2020 | December 2019 | 104.7 | 104.4 | 102.7 | |
| CPI M/M Change | 1/14/2020 | December 2019 | 0.3% | 0.3% | 0.2% | |
| CPI Y/Y Change | 1/14/2020 | December 2019 | 2.1% | 2.3% | 2.3% | |
| Store Sales Y/Y Change | 1/14/2020 | WK 1/11, 2020 | 6.1 % | 5.0 % | ||
| MBA Mortgage Applications W/W Change | 1/15/2020 | WK 1/10, 2020 | -1.5 % | 30.2 % | ||
| PPI FD M/M Change | 1/15/2020 | December 2019 | 0.0 % | 0.2 % | 0.1 % | |
| PPI FD Y/Y Change | 1/15/2020 | December 2019 | 1.1 % | 1.3 % | 1.3 % | |
| Empire State Mfg. Survey | 1/15/2020 | January 2020 | 3.5 | 3.6 | 4.8 | |
| Atlanta Fed Business Infl. Expectations % Yr/Yr | 1/15/2020 | December 2019 | 1.9 % | 1.9% | ||
| Jobless New Claims | 1/16/2020 | WK 1/11, 2020 | 214 K | 215 K | 204 K | |
| Retail Sales M/M change | 1/16/2020 | December 2019 | 0.2% | 0.3% | 0.4% | 0.3% |
| Retail Sales less autos M/M change | 1/16/2020 | December 2019 | 0.1% | 0.0% | 0.5% | 0.7% |
| Philadelphia FED Business Outlook | 1/16/2020 | January 2020 | 0.3 | 3 | 17 | |
| Import Prices M/M Change | 1/16/2020 | December 2019 | 0.2% | 0.3% | 0.3% | |
| Export Prices M/M Change | 1/16/2020 | December 2019 | 0.2% | 0.3% | -0.2% | |
| Import Prices Y/Y Change | 1/16/2020 | December 2019 | -1.3% | 0.4% | 0.5% | |
| Export Prices Y/Y Change | 1/16/2020 | December 2019 | -1.3% | -0.9% | -0.7% | |
| Business Inventories M/M Change | 1/16/2020 | November 2019 | 0.2 % | 0.1 % | -0.1% | -0.2 % |
| Housing Market Index | 1/16/2020 | January 2020 | 76 | 75 | 75 | |
| Foreign Demand for LT US Securities | 1/16/2020 | November 2019 | $32.5 B | $22.9 B | ||
| FED Balance Sheet | 1/16/2020 | WK 1/15, 2019 | $4.150 T | $4.176 T | ||
| Money Supply M2 Weekly Change | 1/16/2020 | WK 1/06, 2019 | $3.5 B | $5.7 B | $1.9 B | |
| Housing Starts | 1/17/2020 | December 2019 | 1.365 M | 1.375 M | 1.373 M | 1.608 M |
| Housing Permits | 1/17/2020 | December 2019 | 1.482 M | 1.474 M | 1.458 M | 1.416 M |
| Industrial Production M/M Change | 1/17/2020 | December 2019 | 1.1% | 0.8% | -0.3 % | -0.3% |
| Manufacturing M/M Change | 1/17/2020 | December 2019 | 1.1% | 1.0% | -0.2 % | 0.2 % |
| Capacity Utilization Rate Level | 1/17/2020 | December 2019 | 77.3 % | 76.6 % | 77.1 % | 77.0 % |
| JOLTS Jobs Openings | 1/17/2020 | November 2019 | 7.267 M | 7.361 M | 7.100 M | 6.800 M |
| Baker-Hughes Rig Count | 1/17/2020 | WK 1/17, 2020 | 984 | 1040 |
This week’s major events:
| Monday | MLK Holiday | ||
| Tuesday | |||
| Wednesday | MBA Mortgage Applications; Chicago FED National Activity Index; Redbook; FFHA Housing Index | ||
| Thursday | Jobless Claims; Leading Indicators; Kansas City FED; Balance Sheet; Money Supply | ||
| Friday | PMI; Baker-Hughes Rig count |
Economy:
Economy kept growing modestly in late 2019. Manufacturing related job cuts was a concern. Retail sales were strong in December in all categories except motor vehicles. Personal consumption increased.
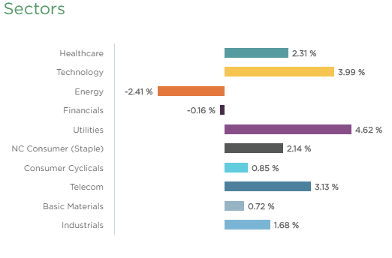
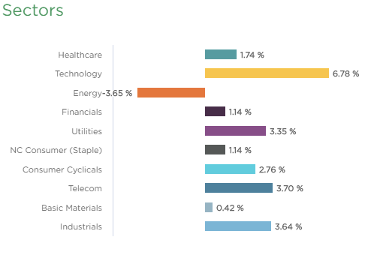
Sector performance
Stock to Watch: None for now.
Many stocks are extended from ideal buy points.
Strongest groups are Medical-Biomed/Biotech, Semiconductor-equipment, Auto Manufacturers, Elect-Contract Manufacturing, Semiconductor-Fabless.
Weakest groups are Retail-Mall, Energy-Coal, Computer Networking, Food-Beverages, Leisure Toys-games
Watch List: Our strong RS/Growth screen is showing following candidates.
PCTY, RNG, EPAM, FIVN, LULU, NOC, IPHI, COST, CPRT, ESNT, KEYS, VRTX, RDN, PODD, CMG, FTNT, FISV, GOOGL, MSFT, NMIH, NTES, INCY, BABA, DOCU, ARES, FB, STNE, NOW, SE, PAYC, SHOP, CROX, AUDC, UFPI, JBL, MHO, IBP, SEDG, SPLK
Summary:
Economic news is positive. January is a good start for this year. Expect volatility to go up short-term. Be prepared to protect your gains from last three months. Intermediate trend continues to be up.