
As overly pessimistic the market was for most of December, it is as somebody flipped a switch on Christmas Day and the market went from super negative to super positive. With a 2.85% jump last week, the S&P 500 continues its
V-shaped recovery. The market is in confirmed rally. Breakouts continue to be relatively scarce. Ideally, we are going to see some overall pullback in the market or at least some consolidation, so that proper base chart patterns can develop.
Brexit continues to dominate headlines in Europe. With the British parliament killing the agreement that Teresa May had negotiated with the EU, the United Kingdom’s future is rather uncertain. With a March 30 deadline looming, lots is happening behind the scenes. Given that the Good Friday agreement stays in place, which ensures that there is no visual border between Northern Ireland and Ireland, it becomes very tricky to imagine a future without some sort of customs union between Northern Ireland and the EU. There are now about six different scenarios how this can play out, encompassing the realm between a hard Brexit all the way to a rerun of the Brexit vote by the electorate. Huge uncertainty.
VIX has declined from 36 to 17 level last week. It needs to go below 16 for sustained up move ahead. If Christmas lows have established intermediate-term lows, then we should start getting tradable opportunities ahead on the long side soon. Don’t plunge into the market. Get in methodically if the right conditions are met.
Recap of last week:
Ideal conditions for lasting Bull: Our best guess is that for the bull market to take hold, Trump will have to avoid implementing new tariffs and come up with some kind of trade agreement where China and US can at least temporary claim victory and place some positive spin. Then China must implement targeted stimulus of some sort that prevents the deceleration of world trade from getting too much worse and the decline in the yuan from continuing. Finally, the FED needs to blink clearly and decisively and be prepared to blink further in terms of slowing QT if the economy decelerates much further. If we get these three developments, it may still be possible to avoid global recession and for the bull market to gradually reappear.
But if any of the above three big policy developments goes other way with substance, or if some debt crisis spillover becomes substantial, we may be looking at a global recession that is likely to morph itself into a rolling series of debt crises and an eventual downturn worse than 2007-2009 straight ahead. We suspect that highest odds outcome is that three of the above will develop in next quarter or two before markets take significant note. Investors are advised to understand precarious nature of the global system and watch for things turning out differently ahead.
Economic Reports:
| Economy Indicator | Released Date | Period | Prior | Prior Revised | Consensus | Actual |
| PPI-FD M/M change | 1/15/2019 | Dec-18 | 0.1% | 0.0% | -0.2% | |
| Empire State Mfg Survey | 1/15/2019 | Jan-19 | 10.90 | 12.00 | 3.90 | |
| Retail Sales M/M change | 1/16/2019 | Dec-18 | 0.2% | 0.1% | ||
| Business Inventories M/M change | 1/16/2019 | Nov-18 | 0.6% | 0.3% | ||
| Housing Market Index | 1/16/2019 | Jan-19 | 56.00 | 57.00 | 58.00 | |
| Housing Starts | 1/17/2019 | Dec-18 | 1.256M | 1.256M | ||
| Housing Permits | 1/17/2019 | Dec-18 | 1.328M | 1.293M | ||
| Jobless Claims -New | 1/17/2019 | Wk 1/12 | 216K | 221K | 213K | |
| Phil Fed Business Survey | 1/17/2019 | Jan-19 | 9.4 | 9.1 | 10 | 17 |
| Industrial Production M/M change | 1/18/2019 | Dec-18 | 0.6% | 0.30% | ||
| Manufacturing M/M | 1/18/2019 | Dec-18 | 0.0% | 0.1% | ||
| Capacity Utilization Rate | 1/18/2019 | Dec-18 | 78.50% | 78.40% | ||
| Consumer Sentiment | 1/18/2019 | 1/1/2019 | 98.30 | 97.00 |
Not much data was released on the US last week. Manufacturing data has come in as expected, but the big uncertainty is a lingering of the government shutdown, which is a drag on GDP growth rates, as it creates a lot of unnecessary waste.
This week’s major events:
| Monday | Holiday Martin Luther King Jr. Day |
| Tuesday | Existing Home Sales |
| Wednesday | MBA Mortgage Applications; FHFA House Price index |
| Thursday | Jobless Claims; Leading Indicators; |
| Friday | Durable Goods Orders; New Home Sales |
Sector performance in last one month ending January 18, 2019:
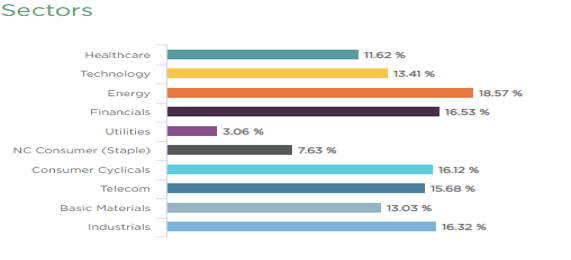
Last month shows impressive performance across all sectors.
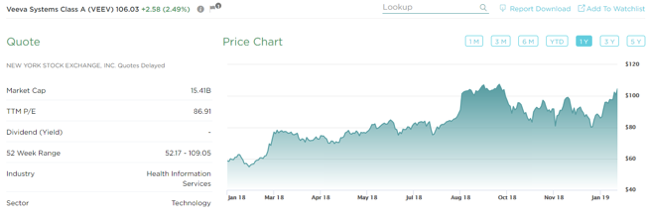
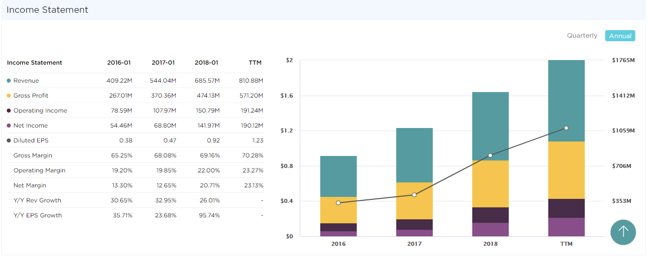
Stock to Watch:
This week we highlight one of our top picks. Veeva Systems Inc has a solid annual growth rate of 44%. Its Gross Margins are expanding for the last four years and are in 70%. Net Margins have also expanded and are 23%. In the past four quarters, EPS has accelerated (5%-43%-63%-80%) with Sales (23%-22%-25%-27%). The estimated EPS growth for 2019 is 67%. Institutional ownership has steadily gone up in the last four quarters.
In a recent market correction, the stock had held up well with only 27% correction and Relative Strength of 97. The stock is setting up to buy above $109.15
Strongest groups are Autos, Auto Parts, Aerospace, Apparel, Telecom
Weakest groups are Transportation & Steel.
Watch List: Our strong RS/Growth screen is showing few candidates, but list is lacking in numbers of stock showing leadership. TEAM, CHGG, FN, PYPL, QNST, DORM, VRTX, FIVN, CASY, LLY
Summary:
Markets have had impressive breaking through resistance levels. We should expect some consolidation here in next few days. Nature of consolidation is important and must hold 50DMA on the indices. Leadership is still lacking. Consolidation here may provide setups for buying in leaders. Let us watch the nature of this consolidation before adding exposure here.