
All three major indexes charged ahead to new highs. Mixed economic data putting a question mark as to ‘how many rate cuts are ahead?’ Earnings report season is in full swing this week with mixed results. Companies meeting expectations are being rewarded, others are being hammered down. GDP growth is slower than last year indicating Trump tax cut effect has worn out and trade tensions are affecting growth. FED meets Tuesday/Wednesday to decide interest rate cuts.
EU zone, Chinese economies are also slowing down. IMF have lowered growth targets again. US Chinese Trade talks to begin this week.
Geopolitical tensions with Iran and N. Korea continue. UK’s new Prime Minister seems ready for hard BREXIT.
Leaders are acting well, and some leaders are making new highs and others are breaking out of new bases. Markets like to climb the wall of worries.
The market is in Uptrend.
Recap of last week:
Economic Reports:
| Economy Indicator | Released Date | Period | Prior | Prior Revised | Consensus | Actual |
| Chicago Fed National Activity | 7/22/2019 | June 19 | -0.05 | -0.03 | 0.00 | -0.02 |
| Redbook Store Sales Y/Y Change | 7/23/2019 | WK 7/20, 2019 | 4.7% | 4.9% | ||
| FHFA Housing Price Index | 7/23/2019 | May 2019 | 0.4% | 0.3% | 0.1% | |
| Existing Home Sales | 7/23/2019 | June 2019 | 5.340M | 5.360M | 5.320M | 5.270M |
| Richmond Fed Mfg Index | 7/23/2019 | July 2019 | 3 | 2 | 5 | -12 |
| MBA Mortgage Applications W/W Change | 7/24/2019 | WK 7/19, 2019 | -1.1% | -1.9% | ||
| PMI Mfg Index | 7/24/2019 | July 2019 | 50.6 | 51.7 | 51.6 | |
| New Home Sales | 7/24/2019 | June 2019 | 626K | 604K | 660K | 646K |
| Durable Goods Order M/M Change | 7/25/2019 | June 2019 | -1.3% | -2.3% | 0.5% | 2.0% |
| International Trade in Goods Balance | 7/25/2019 | June 2019 | $-74.2B | $-75.1B | $-72.5B | $-74.2B |
| Jobless New Claims | 7/25/2019 | WK 7/20, 2019 | 216K | 219K | 206K | |
| Wholesale Inventories M/M % change | 7/25/2019 | June 2019 | 0.4% | 0.3% | 0.2% | |
| Retail Inventories M/M % change | 7/25/2019 | June 2019 | 0.5% | 0.3% | -0.1% | |
| Kansas City Fed Index | 7/25/2019 | July 2019 | 0 | 2 | -1 | |
| FED Balance Sheet | 7/25/2019 | WK 7/24, 2019 | $3.808T | $3.803T | ||
| Money Supply M2 Weekly Change | 7/25/2019 | WK 7/15, 2019 | $0.4B | |||
| Real GDP Q/Q Change | 7/26/2019 | Q2:2019 | 3.1% | 1.9% | 2.1% | |
| Consumer Spending Q/Q Change | 7/26/2019 | Q2:2019 | 0.9% | 1.1% | 3.9% | 4.3% |
| Baker-Hughes Rig Count | 7/26/2019 | WK 7/26, 2019 | 1072 | 1073 |
This week’s major events:
| Monday | Dallas Fed Mfg. Survey | ||
| Tuesday | FOMC Meeting; Personal Income and Outlays; Redbook; Case Shiller HPI; Consumer Confidence; Pending Home Sales Index | ||
| Wednesday | MBA Mortgage Applications; ADP employment Report; Employment Cost Index; Chicago PMI; State Street Investor Confidence; FOMC announcement; FED Chair Press Conference | ||
| Thursday | Challenger Job-Cut Report; Jobless Claims; PMI Mfg. Index; ISM Mfg. Index; Construction Spending; FED Balance Sheet; Money Supply | ||
| Friday | Employment situation; International Trade; Consumer Sentiment; Factory Orders; Baker-Hughes Rig count |
Economy:
GDP expanded at 2.1% annualized rate topping forecast for 1.8% but slower than first quarter 3.1% advance. Consumer spending increased 4.3% and government spending climbed 5%. Nonresidential investment fell 0.6% and residential continued to decrease for past six periods. Trade is weighing on the expansion as exports dropped 5.2% while imports rose just 0.1%.
Retail sales rose year over year by 4.9% last month. Results point to healthy consumer spending by 4.3% against expectation of 3.9%.
FOMC meets this week and is expected to lower rates by quarter point.
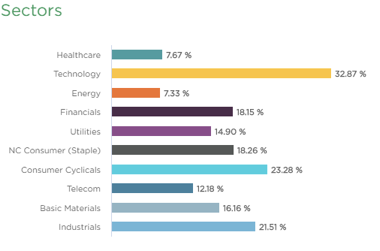
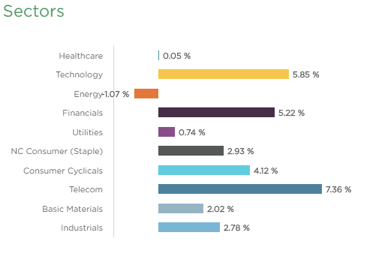
Sector performance:
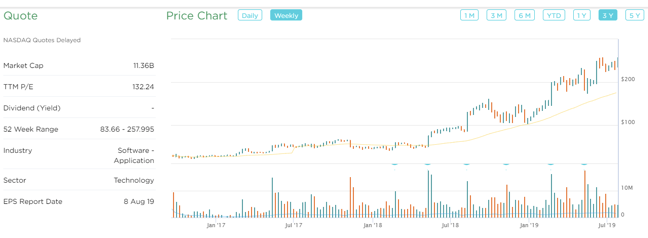
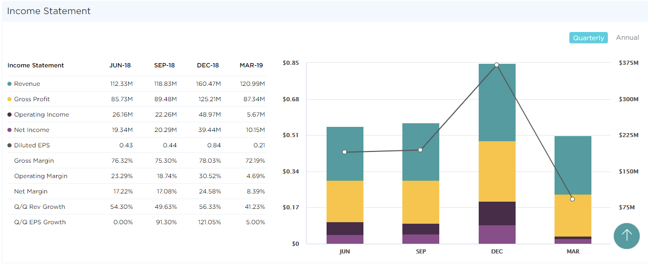
Stock to Watch: Trade Desk (TTD)
The Trade Desk Inc. is engaged in providing a technology platform for ad buyers. It provides self service platform to manage advertising campaigns across various advertising formats.
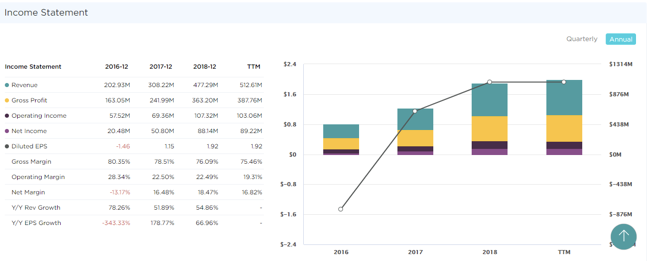
TTD has been growing over 69% annually. Last few quarters sales growth has been fantastic 54%; 50%; 56%; 41% with EPS growth of 15%; 86%; 102%; 44%. Annual EPS in 2016 of -$1.46 has grown to $1.92 in TTM. Estimated EPS growth for next two years is 26%. It has seen growth in equity steadily for past four years. It has ROE of 39% and commands gross margin in mid-seventies. Management owns 3% of shares outstanding. Institutional owners have increased from 442 to 521 in past four quarters showing institutional confidence.
TTD has been the leader in the industry. It has been leader also in current cycle with strong relative strength gaining over 170% within six months showing the highest Relative Strength. It is an ideal time to add/buy TTD as it tries to break out of shallow price consolidation of 13% over 5 weeks
Strongest groups are Energy, Software, Telecom, Insurance, Business service, Computer-Tech services, Computer Software-enterprise, Computer Software-Database, Computer Software-Security.
Weakest groups are Retail, Food, Auto, Media, Medical
Watch List: Our strong RS/Growth screen is showing following candidates.
TEAM, CHGG, PYPL, CYBR, FIVN, SHOP, LLY, LULU, NOW, HUBS, FIVE, ADBE, ADSK, MSFT, HEIA, TWLO, WDAY, ETSY, EPAM, MTCH, LPLA, GDDY; AMZN, PAGS, FB, FNKO, BAH, CPRT, ENTH, HEI, LLL, PAYC, PGR, PODD, VEEV, VRSN, KL, GNRC, CACC, AMD, BZUN, TTD
Summary: Major indexes making new highs. Earnings season is in full swing. Look out for strong RS stocks and add early leaders or new ones that are emerging here.