
Merry Christmas and Happy Holidays!
Mr. Trump is impeached in US Congress. Market has paid no attention to this development indicating that his economic policies are what’s important & he will be exonerated in Senate trial.
Market closes the week to new high. Boris Johnson’s pushes for end of the year BREXIT.
We expect that equities will continue to trend higher through a seasonally strong end-of-year period with positive news background.
Recap of last week:
Economic Reports:
| Economy Indicator | Released Date | Period | Prior | Prior Revised | Consensus | Actual |
| Empire State Mfg. Survey | 12/16/2019 | December 2019 | 2.9 | 4 | 3.5 | |
| PMI Mfg. Flash | 12/16/2019 | December 2019 | 52.2 | 52.4 | 52.5 | |
| Housing Market Index | 12/16/2019 | December 2019 | 70 | 71 | 70 | 76 |
| Foreign Demand for LT US Securities | 12/16/2019 | October 2019 | $49.5 B | $32.5 B | ||
| Housing Starts | 12/17/2019 | November 2019 | 1.314 M | 1.323 M | 1.340 M | 1.365 M |
| Housing Permits | 12/17/2019 | October 2019 | 1.461 M | 1.410 M | 1.482 M | |
| Store Sales Y/Y Change | 12/17/2019 | WK 12/14, 2019 | 5 % | 4.6 % | ||
| Industrial Production M/M Change | 12/17/2019 | November 2019 | -0.8% | -0.9% | 0.9 % | 1.1 % |
| Manufacturing M/M Change | 12/17/2019 | November 2019 | -0.6% | -0.7% | 0.7 % | 1.1 % |
| Capacity Utilization Rate Level | 12/17/2019 | November 2019 | 76.7% | 76.6 % | 77.4 % | 77.3 % |
| JOLTS Jobs Openings | 12/17/2019 | October 2019 | 7.024 M | 7.032 M | 7.015 M | 7.267 M |
| MBA Mortgage Applications W/W Change | 12/18/2019 | WK 12/13, 2019 | 3.8 % | 5.0 % | ||
| Jobless New Claims | 12/19/2019 | WK 12/14, 2019 | 252 K | 221 K | 234 K | |
| Philadelphia FED Business Outlook | 12/19/2019 | December 2019 | 10.4 | 8.5 | 0.3 | |
| Current Account | 12/19/2019 | Q:3 2019 | -$128.2 B | -$125.2 B | -$127.8 B | -$124.1 B |
| Existing Home Sales | 12/19/2019 | November 2019 | 5.460 M | 5.440 M | 5.450 M | 5.350 M |
| Leading Indicators | 12/19/2019 | November 2019 | -0.1 % | -0.2 % | 0.1 % | 0.0 % |
| FED Balance Sheet | 12/19/2019 | WK 12/18, 2019 | $4.095 T | $4.137 T | ||
| Money Supply M2 Weekly Change | 12/19/2019 | WK 12/9, 2019 | $-0.3 B | $-1.4 B | $-19.2 B | |
| Real GDP Q/Q Change | 12/20/2019 | Q3(f):2019 | 2.1 % | 2.1 % | 2.1 % | |
| Real Consumer spending Q/Q Change | 12/20/2019 | Q3(f):2019 | 2.9 % | 2.8 % | 3.2 % | |
| Real Price Index Q/Q Change | 12/20/2019 | Q3(f):2019 | 1.7 % | 1.7 % | 1.8 % | |
| Corporate After-Tax Profits Y/Y change | 12/20/2019 | Q3(r):2019 | -0.4 % | -1.1 % | ||
| Personal Income M/M change | 12/20/2019 | November 2019 | 0.0 % | 0.1 % | 0.3 % | 0.5 % |
| Consumer Spending M/M Change | 12/20/2019 | November 2019 | 0.3 % | 0.4 % | 0.4 % | |
| Consumer Sentiment | 12/20/2019 | Dec(f) 2019 | 99.2 | 99.2 | 99.3 | |
| Kansas City Fed Mfg. Index | 12/20/2019 | December 2019 | -3 | -8 | ||
| Baker-Hughes Rig Count | 12/20/2019 | WK 12/20, 2019 | 952 | 962 |
This week’s major events:
| Monday | Durable Goods Orders; Chicago FED national Activity; New Home sales; Survey of Business Uncertainty | |
| Tuesday | Redbook; Richmond FED Mfg. Index | |
| Wednesday | HOLIDAY | |
| Thursday | Jobless Claims; State Street Investor Confidence Index; Balance Sheet; Money Supply | |
| Friday | Baker-Hughes Rig count |
Economy:
Economic news was positive. Employment picture is good. Personal Income is up and Consumer spending is up. Consumer sentiment is positive. All this bode well for economy. No wonder, Impeachment news has not affected markets.
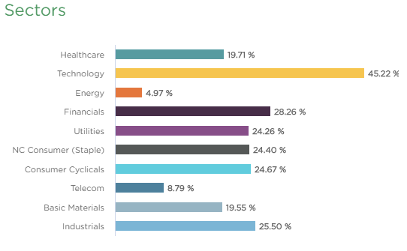
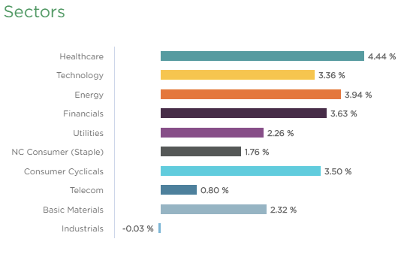
Sector performance:
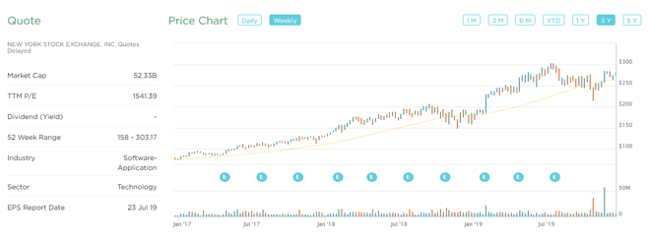
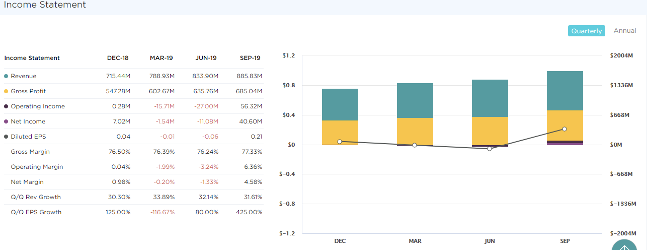
Stock to Watch: ServiceNow Inc. (NOW)
ServiceNow Inc provides software solutions to structure and automate various business processes via a SaaS delivery model. The company primarily focuses on the IT function for enterprise customers. ServiceNow began with IT service management (ITSM), expanded within the IT function, and more recently directed its workflow automation logic to functional areas beyond IT, notably customer service, HR service delivery, and security operations. ServiceNow also offers an application development platform as a service (PaaS).
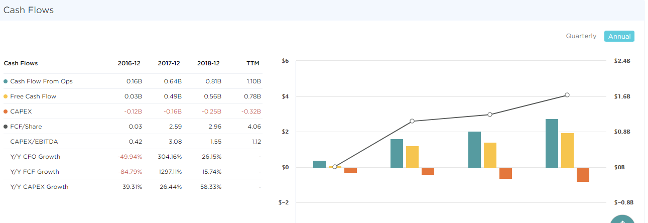
ServiceNow Inc. has annual growth over 132 percentages. ROE of 50 % and sales growth of 30%; 34%; 32% and 32% in past four quarters. Gross margins are in mid-seventies consistently. FCF/Share has doubled from $0.03 (2016) to $4.06 (TTM) over last four years. Estimated EPS growth of 30% for next year. Institutional participation has increased steadily from 1460 to 1800.
We expect price appreciation to continue near term and over next year for our old favorite.
Strongest groups are Medical-Biomed/Biotech, Semiconductor-equipment, Auto Manufacturers, Elect-Contract Manufacturing, Semiconductor-Fabless.
Weakest groups are Retail-Mall, Energy-Coal, Food-Beverages, Oil and Gas, Leisure Toys-games, Telecom-infrastructure
Watch List: Our strong RS/Growth screen is showing following candidates.
PCTY, RNG, EPAM, FIVN, LULU, NOC, IPHI, COST, CPRT, ESNT, KEYS, VRTX, RDN, PODD, CMG, FTNT, FISV, GOOGL, MSFT, NMIH, NTES, INCY, BABA, DOCU, ARES, FB, STNE, NOW, SE, PAYC, SHOP, CROX, AUDC, UFPI, JBL, MHO, IBP, SEDG, SPLK
Summary: Santa Claus rally continues. Economic news is positive. Sentiment is getting overdone.