
Market does not seem to take a breather after strongest performance since Q1 of 2009. News of improving Chinese economy is adding wings to this market. SPX has closed above resistance zone around 2815. It suggests global economy may be coming out of soft patch. BREXIT has been postponed till May 22. The market has turned back to ‘Confirmed Up trend’ today. Our models are positive for intermediate & long trend. Stay focused on strong holdings and opportunity to add to them.
Recap of last week:
Economic Reports:
| Economy Indicator | Released Date | Period | Prior | Prior Revised | Consensus | Actual |
| Chicago Fed National Activity | 3/25/2019 | Feb 19 | -0.43 | -0.25 | 0.10 | -0.29 |
| Dallas Fed Mfg Survey | 3/25/2019 | March 19 | 10.1 | 11.5 | ||
| Housing Strats | 3/26/2019 | Feb 19 | 1.230M | 1.273M | 1.201M | 1.162M |
| Redbook | 3/26/2019 | WK 3/23, 2019 | 4.9% | 5.3% | ||
| Case Shiller HPI M/M | 3/26/2019 | Jan 19 | 0.2% | 0.3% | 0.1% | |
| Richmond Fed Mfg Index | 3/26/2019 | March 19 | 16 | 12 | 10 | |
| MBA Mortgage Applications W/W Change | 3/27/2019 | WK 3/22, 2019 | 1.6% | 8.9% | ||
| GDP Q/Q change | 3/28/2019 | Q4, 2018 | 2.6% | 2.2% | 2.2% | |
| Jobless Claims | 3/28/2019 | WK 3/23, 2019 | 221K | 216K | 225K | 211K |
| Pending Home Sales M/M Change | 3/28/2019 | Feb 19 | 4.6% | 4.3% | -0.8% | -1.0% |
| Corporate Profits | 3/28/2019 | Q4; 2018 | 6.1% | 11.1% | ||
| Chicago PMI | 3/29/2019 | March 19 | 64.7 | 60.3 | 58.7 | |
| New Home Sales | 3/29/2019 | Feb 19 | 607K | 636K | 615K | 667K |
| Consumer Sentiment | 3/29/2019 | March 19 | 97.8 | 97.8 | 98.4 | |
| Baker-Hughes Rig Count | 3/29/2019 | Wk 3/29 2019 | 1121 | 1094 |
This week’s major events:
| Monday | Retail Sales; PMI Manufacturing Index |
| Tuesday | Durable Goods Order; Redbook |
| Wednesday | MBA Mortgage Applications; PMI Services Index; ISM Non-Mfg Index |
| Thursday | Challenger Report; Jobless Claims |
| Friday | Employment situation; Consumer Credit; Baker-Hughes Rig count |
Economy:
Retail numbers are below expectations. GDP numbers are ok but not great. Inverted Yield curve is something to watch.
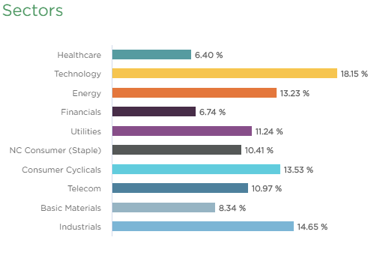
Sector performance First Quarter performance ending March 31, 2019:
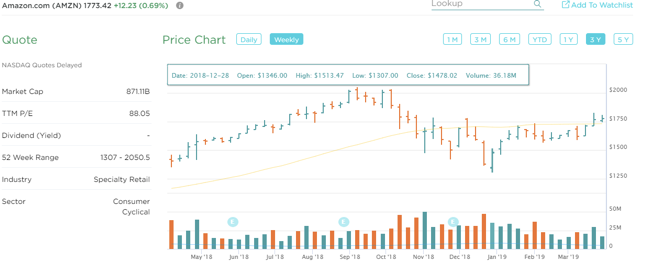
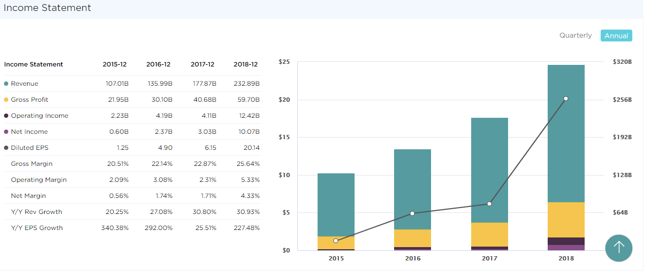
Stock to Watch: AMAZON (AMZN)
Amazon is in ‘Specialty Retail’ group with outstanding historical performance. Amazon has been growing 117% annually. Last few quarters sales growth has been 39%; 29%; 20% with EPS growth in triple digits. Amazon’s annual EPS in 2017 of $4.55 has grown to $20.14 in 2018. Its revenue growth trajectory continues. Estimated growth for next two years is 40%. It also has fantastic operating cash flow increases. Free cash flow per share has grown from $14 in 2017 to $26 for 2018. Operating margins have grown from 2.5% to 5.3%. It is ideal time to buy Amazon here, close to support.

Strongest groups are Energy, Software, Finance, Medical, Insurance, Mining, Computer-Tech services, Computer Software-enterprise, Computer Software-Database, Telecom, Computer Software-Security.
Weakest groups are Transport; Retail; Food.
Watch List: Our strong RS/Growth screen is showing following candidates. List is expanding this week.
TEAM, CHGG, FN, PYPL, CYBR, BEAT, VRTX, FIVN, CASY, LLY, LULU, NOW, SAVE, HUBS, BA, FIVE, ADBE, INCY, ABMD, PANW, SSNC, ADSK, MSFT, HEIA, UBNT, TWLO, TTD, WDAY, ETSY, EPAM, LPLA, FTNT, GDDY; AMZN
Summary:
Markets are unwilling to go to long term support levels at 200DMA. It barely tested 20DMA for one-week retracement. Let us watch which stocks perform best on relative basis from the list of strong stocks. Few stocks are forming tight range. Break out of those ranges will be one way to add to our portfolio.