
As we suspected 200DMA resistance is at work. So far market is handling it ok with end of the day rallies from lows. The market is in confirmed rally. Volatility index VIX has tested breakout of support level 16. This is encouraging for bulls. Earnings reports have been somewhat volatile. Some with positive results are breaking out with gap up while some gap down.
This week CNN reported US-China trade talks are not close enough for a deal. Mr. Trump and Chinese President Xi Jinping meeting most likely will not take place by March 1,2019 as had been expected. Euro Commission lowered EURO zone growth forecast for 2019 from 1.9% to 1.3%.
Political Headwinds:
With the Fed on hold and President Trump anxious to wrap up his trade wars, the Dow Jones is rebounding from a punishing correction. But political risk looms large in the stock market outlook.
Heading into the presidential election, political friction will be impossible for the stock market to ignore. The Robert Mueller Russia probe is wrapping up, House Democrats eager to consider a Trump impeachment which may not pass through Senate. Left-wing Democrats led by rock-star freshman Rep. Alexandria Ocasio-Cortez are calling for 70% marginal tax rates on the wealthy. Sen. Elizabeth Warren, D-Mass., a 2020 presidential contender, just rolled out a wealth tax plan estimated to raise $2.75 trillion over a decade. That would be a heavy tax on investors.
The fiscal tailwinds of tax cuts and lax spending are about to turn into a modest headwind for the economy and the stock market outlook. “We can now begin to see that the wealth gap issue will probably be the biggest issue of the election,” Ray Dalio, founder of hedge fund behemoth Bridgewater Associates
“This will become increasingly apparent,” Dalio wrote, highlighting emerging Democratic plans for a 70% marginal tax rate and wealth tax. “We know these things will have big implications for capital flows, market valuations, economic conditions, and domestic and international relations.”
Trump’s own unpopularity and diminishing 2020 election prospects could undermine the economy and stock market, creating a negative feedback loop.
Recap of last week:
Economic Reports:
| Economy Indicator | Released Date | Period | Prior | Prior Revised | Consensus | Actual |
| Factory Orders | 2/4/2019 | Nov-18 | -2.1% | 0.2% | -0.6% | |
| ISM Non-mfg Index | 2/5/2019 | Jan-19 | 57.6 | 58 | 57.1 | 56.7 |
| Nonfarm productivity Q/Q change | 2/6/2019 | Q4:2018 | 2.3% | 2.2% | 1.6% | |
| Unit labor costs Q/Q change | 2/6/2019 | Q4:2018 | 0.9% | 1.7% | ||
| Employment Change Q/Q | 2/6/2019 | Q4:2018 | -1.1% | 1.0% | 0.1% | |
| Unemployment Rate | 2/6/2019 | Q4:2018 | 3.9% | 4.0% | 4.3% | |
| New Claims | 2/7/2019 | wk2/2 2019 | 223k | 223k | 234k | |
| FED Balance Sheet level | 2/7/2019 | wk2/6 2019 | $4.40T | $4.026T |
This week’s major events:
| Monday | CPI; GDP; Industrial Production |
| Tuesday | JOLTS report |
| Wednesday | CPI; PPI |
| Thursday | Jobless Claims; PPI-FD; Business Inventories; UK Parliament Vote on Brexit deal |
| Friday | Retail Sales; Empire State Mfg survey; Consumer Sentiment |
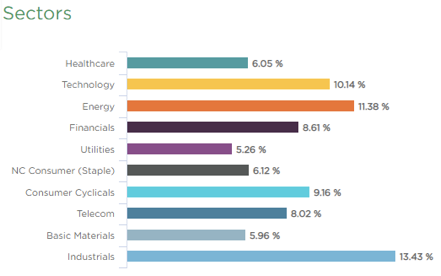
Sector performance YTD ending Feb 8, 2019:
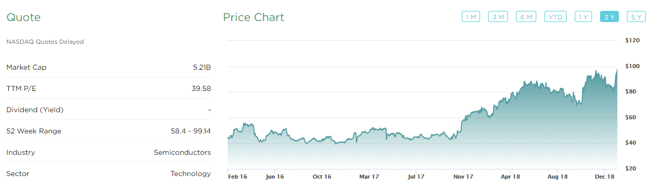
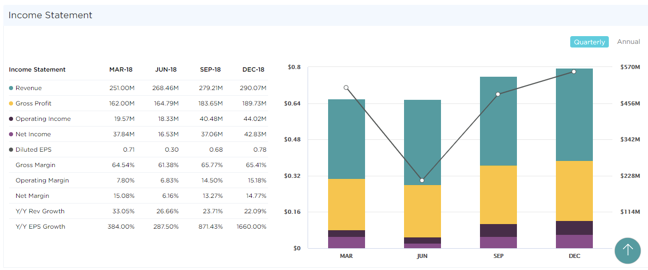
Stock to Watch: Mellanox Technologies
This week we highlight Mellanox Technologies (MLNX). Israeli Semiconductor designer company has a solid annual growth rate of 36%. Return on Equity is 22.6%. Its Gross Margins are 65%. Net Margins have expanded steadily from 24% to 27%. In past four quarters, EPS has been steady (238%; 184%; 87%; 73%) with Sales growth (33%; 27%; 24%; 22%). Next Qtr EPS est is 47%. This year 2019 EPS estimates are indicating growth of 23%. Institutional ownership has steadily gone up in last four quarters from 250 to 327.
In recent market correction, stock had held up well with only 20% correction. Stock is setting up for buy above $99.25
Strongest groups are Computer-Tech services, Computer Software-enterprise, Computer Software-Database, Telecom, Computer Software-Security.
Weakest groups are Oil& Gas Exploration & production, Transportation & Steel.
Watch List: Our strong RS/Growth screen is showing following candidates. TEAM, CHGG, FN, PYPL, CYBR, BEAT, VRTX, FIVN, CASY, LLY, LULU, NOW, SAVE, HUBS, BA, FIVE, ADBE, MLNX
Summary:
Markets are consolidating at 200DMA resistance. More leaders are participating in the rally. It’s ok to add exposure to strong groups. Markets are consolidating at 200DMA resistance. More leaders are participating in the rally. It’s ok to add exposure to strong groups.