
Happy NEW YEAR!
Stocks closes the week to new high. Stocks are up 13% as of Friday, Jan 10, 2020 for the past three months. This strength implies further advances this year.
Earnings reports for the fourth quarter of 2019 will start rolling in on Tuesday. Forward guidance will be important during this earnings season. Keep focus on fundamentals. US and China are poised to sign a limited trade agreement on Wednesday. US has removed ‘currency manipulator’ tag for China. For now, markets have shrugged off the prospects for further escalation in the Iran conflict, but the situation could still flare up at any moment. We encourage investors to be prepared for volatility with major indexes at record highs.
Recap of last week:
Economic Reports:
| Economy Indicator | Released Date | Period | Prior | Prior Revised | Consensus | Actual |
| Motor vehicle sales | 1/6/2020 | December 2019 | 17.1 M | 17 M | 16.7 M | |
| PMI Services Index | 1/6/2020 | December 2019 | 51.6 | 52.2 | 52.8 | |
| International Trade Balance | 1/7/2020 | November 2019 | $-47.2 B | $-46.9 B | $-43.9 B | $-43.1 B |
| Store Sales Y/Y Change | 1/7/2020 | WK 1/4, 2020 | 7.8 % | 6.1 % | ||
| Factory Orders M/M Change | 1/7/2020 | November 2019 | 0.3 % | 0.2 % | -0.7 % | -0.7 % |
| ISM Non-Mfg. Index | 1/7/2020 | November 2019 | 53.9 | 54.5 | 55 | |
| MBA Mortgage Applications W/W Change | 1/8/2020 | WK 1/3, 2020 | -5.3 % | -1.5 % | ||
| ADP Employment Report | 1/8/2020 | December 2019 | 67,000 | 124,000 | 157,000 | 202,000 |
| Consumer Credit M/M Change | 1/8/2020 | November 2019 | $18.9 B | $19 B | $16.7 B | $12.5 B |
| Jobless New Claims | 1/9/2020 | WK 1/4, 2020 | 222 K | 223 K | 219 K | 214 K |
| FED Balance Sheet | 1/9/2020 | WK 1/8, 2019 | $4.174 T | $4.150 T | ||
| Money Supply M2 Weekly Change | 1/9/2020 | WK 12/30, 2019 | $4.7 B | $3.5 B | ||
| Non-farm Payrolls M/M change | 1/10/2020 | December 2019 | 266,000 | 256,000 | 158,000 | 145,000 |
| Unemployment Rate | 1/10/2020 | December 2019 | 3.5 % | 3.5 % | 3.5 % | |
| Private Payrolls M/M Change | 1/10/2020 | December 2019 | 254,000 | 243,000 | 150,000 | 139,000 |
| Average Hourly Earnings M/M change | 1/10/2020 | December 2019 | 0.2 % | 0.3 % | 0.3 % | 0.1 % |
| Average Workweek | 1/10/2020 | December 2019 | 34.4 hrs. | 34.3 hrs. | 34.4 hrs. | 34.3 hrs. |
| Manufacturing Payrolls M/M Change | 1/10/2020 | December 2019 | 54,000 | 58,000 | -1,000 | -12,000 |
| Wholesale Inventories M/M % change | 1/10/2020 | November 2019 | 0.1% | 0.0% | -0.1 % |
This week’s major events:
| Monday | US Treasury Budget | |
| Tuesday | NFIB Small Business Optimism Index; CPI; Redbook | |
| Wednesday | MBA Mortgage Applications; PPI-FD; Empire State Mfg. Survey; Atlanta Fed Business Inflation Expectations; Beige Book | |
| Thursday | Jobless Claims; Philadelphia FED Business Outlook survey; Retail sales; Import Export prices; Business Inventories; Housing Market Index; Treasury International Capital; Balance Sheet; Money Supply | |
| Friday | Housing Starts; Industrial production; Consumer sentiment; JOLTS; Baker-Hughes Rig count |
Economy:
Economy wrapped up December and closed out 2019 with generally promising data. Trade remained a big story. Underlying data on consumer was mixed, and manufacturing data sent conflicting signals.
The Conference Board’s Leading Economic Index (LEI) rose 0.1% year over year in November, its slowest pace of growth since 2009. Even though LEI growth has slowed, the gauge is still positive year over year. Nonfarm payrolls growth rose to a 10-month high in November, according to the data released in early December. October and September payrolls growth were revised upwards. The 12-month average payrolls change through October was noticeably above the expansion average. Consumer inflationary pressures appeared healthy and manageable. The core Consumer Price Index (CPI), which excludes food and energy prices, climbed 2.3% year over year in November, around a cycle high. Wages, which comprise about 70% of business costs, rose 3.1% year over year in November. Still, producer price growth declined. The core Producer Price Index increased 1.5% year over year in November, the slowest pace of growth since September 2016.
Core personal consumption expenditures (PCE), the Federal Reserve’s (Fed) preferred inflation gauge, increased 1.6% year over year in November. Year-over-year core PCE growth is still below the Fed’s 2% growth target. U.S. manufacturing data sent conflicting signals. The Institute for Supply Management’s (ISM) Purchasing Managers’ Index (PMI) hovered around a 10-year low in November. On the other hand, Markit’s U.S. manufacturing PMI, which is constructed differently and tends to be more forward looking, jumped to a seven-month high in November and has remained in expansionary territory.
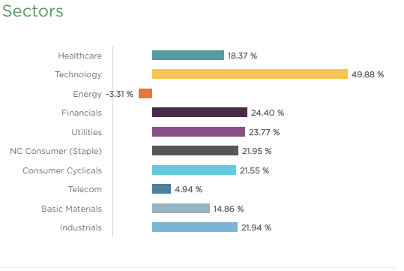
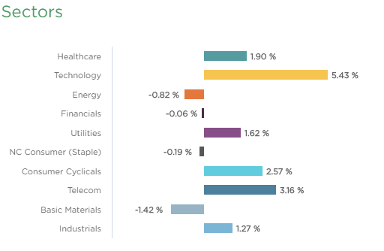
Sector performance
Stock to Watch: None for now.
Many stocks are extended from ideal buy points.
Strongest groups are Medical-Biomed/Biotech, Semiconductor-equipment, Auto Manufacturers, Elect-Contract Manufacturing, Semiconductor-Fabless.
Weakest groups are Retail-Mall, Energy-Coal, Food-Beverages, Leisure Toys-games, Telecom-infrastructure
Watch List: Our strong RS/Growth screen is showing following candidates.
PCTY, RNG, EPAM, FIVN, LULU, NOC, IPHI, COST, CPRT, ESNT, KEYS, VRTX, RDN, PODD, CMG, FTNT, FISV, GOOGL, MSFT, NMIH, NTES, INCY, BABA, DOCU, ARES, FB, STNE, NOW, SE, PAYC, SHOP, CROX, AUDC, UFPI, JBL, MHO, IBP, SEDG, SPLK
Summary:
Strong end for year 2019 with positive news on trade deal with China. Economic news is positive. Expect volatility to go up. Be prepared to protect your gains from last three months. Intermediate trend continues to be up.