
After sharp but normal correction last week, market has overcome resistance zone for NASDAQ & SPX on higher volume. This is bullish for market, considering Boeing got hammered and BREXIT got postponed. Good news on Friday was Chinese newspaper reports indicating ‘progress’ in trade talks. Trade deal is critical for bull case. Some of the economic news in US was not so great last week. Negative news hasn’t affected this market. The market is in confirmed rally. Our models are positive for intermediate & long trend. We are little cautious on short-term trend. Investors should be focused on intermediate term and long-term trends. Stay focused on strong holdings and opportunity to add to them. Find opportunities to buy in Leaders. Do not chase laggards.
Recap of last week:
Economic Reports
| Economy Indicator | Released Date | Period | Prior | Prior Revised | Consensus | Actual |
| US Retail Sales M/M change | 3/11/2019 | Jan 19 | -1.2% | -1.6% | 0.1% | 0.2% |
| Business Inventories M/M Change | 3/11/2019 | Dec-18 | -0.1% | 0.0 | 0.6% | 0.6% |
| CPI M/M Change | 3/12/2019 | Feb 19 | 0.0% | 0.2% | 0.2% | |
| Store Sales Y/Y Change | 3/12/2019 | Wk3/9, 2019 | 4.2% | 4.4% | ||
| Durable Goods Order (New) M/M Change | 3/13/2019 | Jan 19 | 1.2% | 1.3% | -0.6% | 0.4% |
| PPI-FD M/M Change | 3/13/2019 | Feb 19 | -0.1% | 0.2% | 0.1% | |
| Construction Spending | 3/13/2019 | Jan 19 | -0.6% | -0.8% | 0.3% | 1.3% |
| E-Commerce Retail Sales | 3/13/2019 | Q-4:2018 | 3.1% | 2.6% | 2.0% | |
| Jobless Claims -New | 3/14/2019 | Wk3/9, 2019 | 223K | 225K | 225K | 229K |
| New Home Sales | 3/14/2019 | Jan 19 | 621K | 652K | 612K | 607K |
| Empire State Mfg Survey | 3/15/2019 | Mar 19 | 8.8 | 10 | 3.7 | |
| Industrial Production M/M Change | 3/15/2019 | Feb 19 | -0.6% | -0.4% | 0.4% | 0.1% |
| Consumer Sentiment | 3/15/2019 | Mar 19 | 93.8 | 95.2 | 97.8 | |
| Job Openings | 3/15/2019 | Jan 19 | 7,355M | 7,479M | 7200M | 7,581M |
| Baker-Hughes Rig Count | 3/15/2019 | Wk 3/15 2019 | 1216 | 1187 |
This week’s major events:
| Monday | Housing Market Index |
| Tuesday | Redbook; Factory Orders |
| Wednesday | Mortgage Applications; FOMC meeting & Press Conference |
| Thursday | Jobless Claims; Leading Indicators; Qtrly Services Survey |
| Friday | PMI; Existing Home Sales; Wholesale Trade; Baker Hughes Rig Count |
Economy:
FOMC meeting, FED Chairman’s news conference will highlight this week & could be impetus for shut out rally.
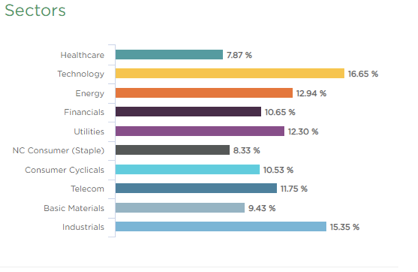
Sector performance YTD ending March 15, 2019:
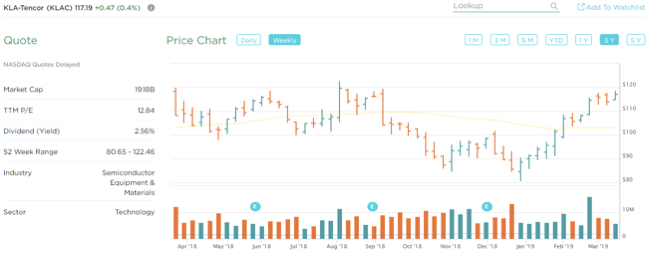
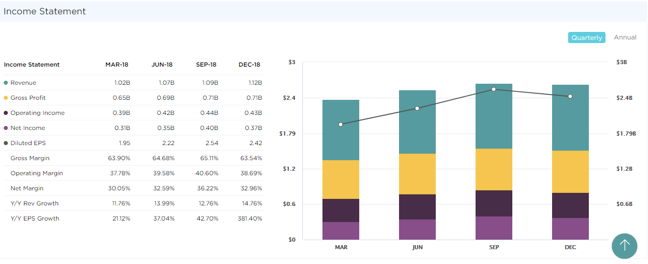
Stock to Watch: KLA-Tencor (KLAC).
This week’s pick is KLA-Tencor (KLAC). Company manufactures process control and yield management systems for Semiconductor, Nanoelectronics, LED and Data Storage. It has annual growth rate of 25% with low P/E of 13. Return on Equity is 88%. Its Gross Margins are 65%. Net Margins have expanded steadily from 30% to 36%. In past few quarters, EPS has been growing (21; 37%; 42%; 381%) with quarterly Sales growth (12%; 14%; 13%; 15%). This is a good play in semiconductor technology which is showing momentum in last few weeks.
Strongest groups are Energy, Software, Finance, Medical, Insurance, Mining, Computer-Tech services, Computer Software-enterprise, Computer Software-Database, Telecom, Computer Software-Security.
Weakest groups are Transport; Retail; Food.
Watch List: Our strong RS/Growth screen is showing following candidates. List is expanding this week.
TEAM, CHGG, FN, PYPL, CYBR, BEAT, VRTX, FIVN, CASY, LLY, LULU, NOW, SAVE, HUBS, BA, FIVE, ADBE, INCY, ABMD, PANW, SSNC, ADBE, ADSK, MSFT, HEIA, UBNT, TWLO, TTD, WDAY, ETSY, EPAM, LPLA, FTNT, GDDY.
Summary: Markets have overcome critical resistance last week. We should see support at these levels going forward.