
After strong back to back selloffs on Tuesday and Wednesday to 200DMA, the market bounced back strongly on Thursday and Friday to close the week only 0.2% down. Sideways action continues.
VIX indicator still trading above 50DMA indicating environment is still choppy.
The impeachment train is gathering steam as the developments are coming thick and fast. Voter sentiment is turning against the president with more and more voters welcoming an impeachment inquiry. Nonetheless, even if the impeachment commission suggests the removal of the president, such a removal is highly unlikely at this point, as 20 Republican senators would have to switch sides.
Recap of last week:
Economic Reports:
| Economy Indicator | Released Date | Period | Prior | Prior Revised | Consensus | Actual |
| Chicago PMI | 9/30/2019 | Sept 2019 | 50.4 | 50.4 | 47.1 | |
| Dallas Fed Mfg. Survey | 9/30/2019 | Sept 2019 | 17.9 | 13.9 | ||
| Store Sales Y/Y Change | 10/1/2019 | WK 9/28, 2019 | 5.2 % | 5.8 % | ||
| PMI Mfg. Index | 10/1/2019 | Sept 2019 | 50.3 | 51 | 51.1 | |
| ISM Mfg. Index | 10/1/2019 | Sept 2019 | 49.1 | 50 | 47.8 | |
| Construction spending M/M Change | 10/1/2019 | Sept 2019 | 0.1 % | 0.0 % | 0.3% | 0.1% |
| Motor Vehicle Sales | 10/2/2019 | Sept 2019 | 17.0 M | 16.9 M | 17.2 M | |
| MBA Mortgage Applications W/W Change | 10/2/2019 | WK 9/27, 2019 | -10.1 % | 8.1 % | ||
| ADP Employment Report | 10/2/2019 | Sept 2019 | 195,000 | 157,000 | 152,000 | 135,000 |
| Challenger Job cut Report | 10/3/2019 | Sept 2019 | 53,480 | 41,557 | ||
| Jobless New Claims | 10/3/2019 | WK 9/28, 2019 | 213 K | 215 K | 216 K | 219 K |
| PMI Services Index | 10/3/2019 | Sept 2019 | 50.7 | 50.9 | 50.9 | |
| ISM Non-Mfg. Index | 10/3/2019 | Sept 2019 | 56.4 | 55.5 | 52.6 | |
| Factory Orders M/M Change | 10/3/2019 | August 2019 | 1.4 % | -0.6 % | -0.1 % | |
| FED Balance Sheet | 10/3/2019 | WK 10/2, 2019 | $3.858 T | $3.946 T | ||
| Money Supply M2 Weekly Change | 10/3/2019 | WK 9/23, 2019 | $10.4 B | $70.2 B | ||
| International Trade Balance | 10/4/2019 | August 2019 | $-54.0 B | $-54.5 B | $-54.9 B | |
| Non-farm Payrolls M/M change | 10/3/2019 | Sept 2019 | 130,000 | 168,000 | 145,000 | 136,000 |
| Unemployment Rate | 10/3/2019 | Sept 2019 | 3.7 % | 3.7 % | 3.5 % | |
| Private Payrolls M/M Change | 10/4/2019 | Sept 2019 | 96,000 | 122,000 | 135,000 | 114,000 |
| Average Hourly Earnings M/M change | 10/4/2019 | Sept 2019 | 0.4% | 0.3 % | 0.0 % | |
| Average Workweek | 10/4/2019 | Sept 2019 | 34.4 hrs. | 34.4 hrs. | 34.4 hrs |
This week’s major events:
| Monday | Consumer Credit; Ameritrade Investor sentiment | ||
| Tuesday | Redbook; NFIB Small Business Optimism Index; PPI-FD | ||
| Wednesday | MBA Mortgage Applications; JOLTS; Wholesale Trade; FOMC Minutes; Chairman Powell speaks | ||
| Thursday | CPI; Jobless Claims; Treasury Budget; FED Balance sheet; Money supply | ||
| Friday | Import Export Prices; Consumer Sentiment; Baker-Hughes Rig count |
Economy:
The monthly labor report was roughly in line with expectations. The economy added 136,000 new jobs, slightly less than expected. However, previous month’s figures were revised upward. We have now experienced an unprecedented 108 months of consecutive monthly job growth. The unemployment rate dropped to a 50-year low to 3.5%. Despite those record low unemployment numbers, the important wage growth figure came in lower than expected at 2.9% 12-month growth vs. 3.2% expected.
Manufacturing activity dropped the second month in a row and is unlikely to rebound, given the new tariffs that US has imposed on imports from certain European countries. The WTO has given the US the green light to impose such tariffs, due to the not allowed support that the EU has given Airbus.
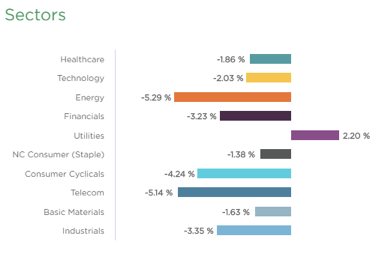
Sector performance:
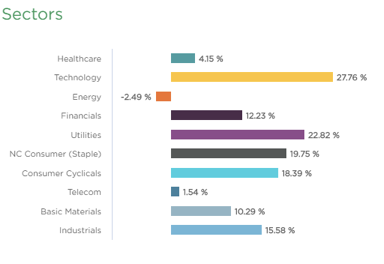
Stock to Watch: None
Strongest groups are Mining-Gold/Silver, Energy-Solar, Retail Automobile, Aerospace/Defense, Building Construction, Telecom, Insurance, Semiconductor Equipment
Weakest groups are Oil and Gas, Retail-Mall, Tobacco, Steel Producers, Food
Watch List: Our strong RS/Growth screen is showing following candidates.
CMG, PAGS, PCTY, TEAM, RNG, EPAM, FIVN, LULU, SEDG, NOC, IPHI, COST, CPRT, ESNT
Summary:
Short-term indicators suggest caution near-term, but intermediate-term indicators are strong enough that any correction should be less substantial than that of August and should be relatively short-lived and transition to a rally to new highs in the weeks and months ahead. Trade lightly.